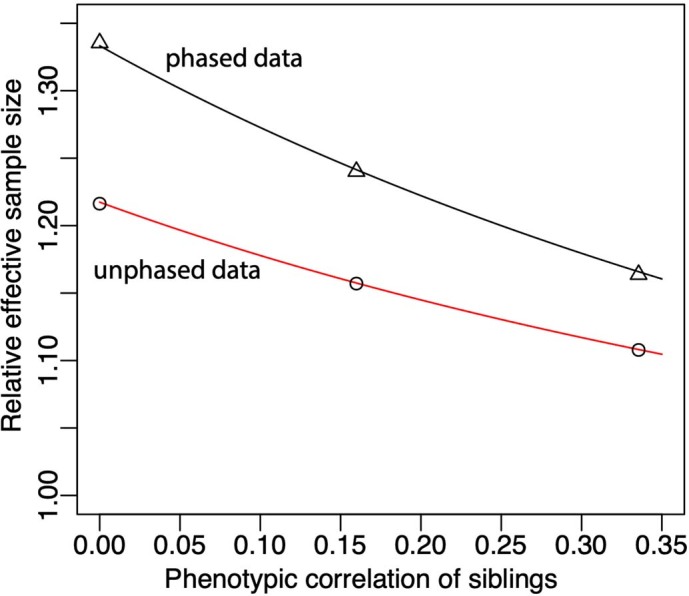
Extended Data Fig. 3. Confirmation of theoretical result for direct effects.

Here we compare theoretical predictions to results from simulated data for the effective sample size for estimation of direct genetic effects using parental genotypes imputed from both phased and unphased sibling genotype data relative to estimating direct genetic effects using genetic differences between siblings. For 3,000 independent families, we simulated three different traits affected by direct, paternal, and maternal effects of 1,000 SNPs with minor allele frequency 0.5 (Supplementary Note Section 12.1). The overall variance explained by the combined direct, paternal, and maternal effects varied between the simulations, leading to different correlations between siblings’ phenotypes. We computed theoretical expectations based on formulae derived in Supplementary Note Section 4.3, which are drawn as the red curve (theoretical expectation for imputation from unphased data) and the black curve (theoretical expectation for imputation from phased data). The simulation results for unphased data are given by the black circles, and the simulation results for the phased data are given by black triangles. The relative effective sample size is given by the ratio between the sampling variance for estimation of direct effects when using differences between siblings to the sampling variance when using parental genotypes imputed from phased or unphased data.
