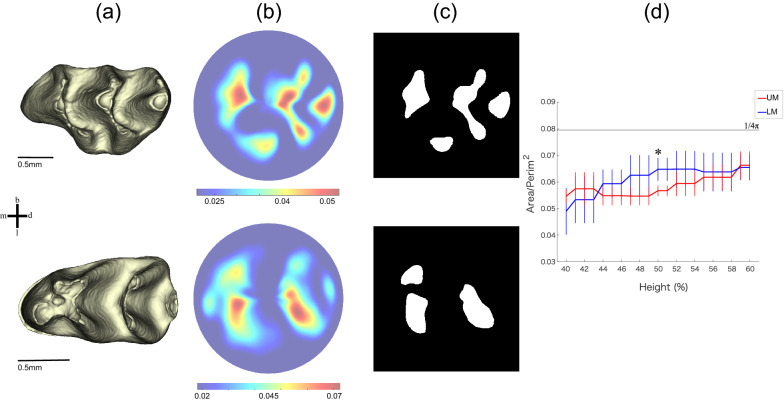
Figure 1.
Scheme for 2D pattern extraction. (a) The 3D models of enamel–dentine junction. The three-dimensional surface models derived from µCT data were visualized by an in-house program, ForMATit, developed by N.M. [MATLAB-based (MathWorks, Version R2021b, https://www.mathworks.com/products/matlab.html)]. (b) Morphometric maps of the height from the cervical plane in UM and LM. (c) Binarized image at 50% of total height. White regions are above the threshold. Top and bottom panels show UM and LM, respectively. m mesial, d distal, b buccal, l lingual. (d) A dimensionless index calculated as area/squared perimeter is used to distinguish between stripe and spot patterns. Significant differences between UM and LM were detected (the number of samples, n = 10 for each of UM and LM; the probability of null hypothesis by Kruskal–Wallis test, p < 0.001) at 40–60% of the total height from the cervical plane. The mean and standard deviation at each threshold level are indicated with a polygonal line and whisker, respectively. The asterisk indicates the threshold at the 50% level where binarized images of (d) are derived. The black line indicates a constant in the case of circle (1/4π).

