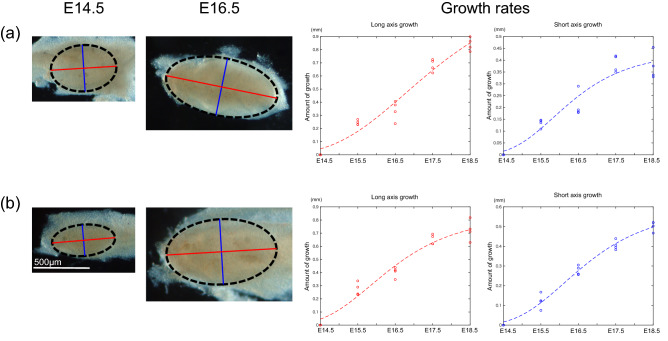
Figure 3.
Modeling of molar growth. The length along the long and short axes of tooth germ is measured every other day from E14.5 to E18.5 (n = 4 for each time point) in UMs (a) and LMs (b). The parameters for fitting growth rates are the following: UM long axis, α = 1.267; β = 3.337; γ = 0.5316 (r2 = 0.96). UM short axis, α = 0.4295; β = 3.342; c = 0.9023 (r2 = 0.91). LM long axis, α = 0.8218; β = 2.895; γ = 0.7901 (r2 = 0.95). LM short axis, α = 0.5811; β = 3.577; γ = 0.7851 (r2 = 0.98). The ellipse with the black dashed line indicates tooth germ, and red and blue lines correspond to long and short axes, respectively.

