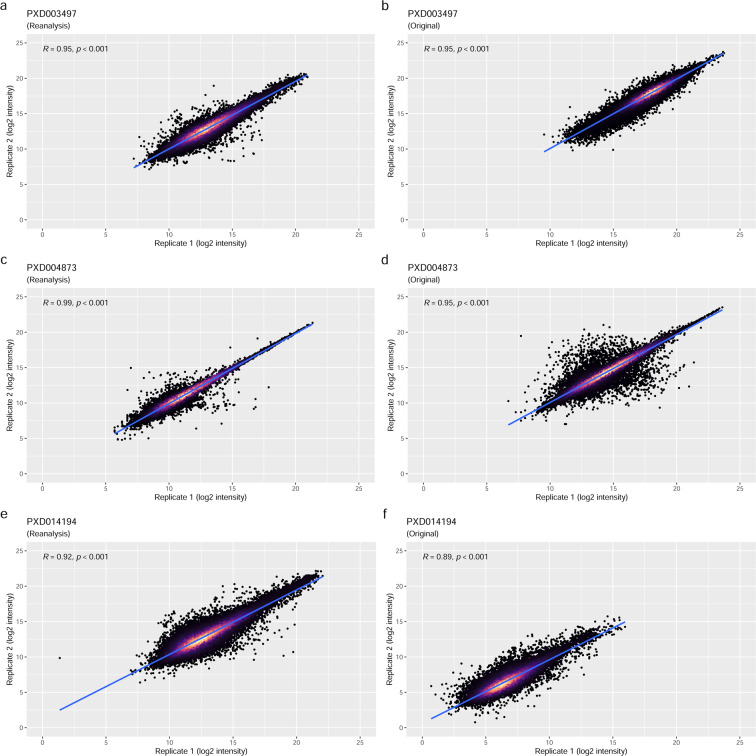
Fig. 4.
Correlation analysis of reported log2 protein intensities from technical replicate pairs: (a) PXD003497 reanalysis; (b) PXD003497 original data; (c) PXD004873 reanalysis; (d) PXD004873 original data; (e) PXD014194 reanalysis; (f) PXD014194 original data. The first items of pairs are on the x-axis and second items are on the y-axis. Each point represents a protein. The point density is indicated by the colour gradient, with black showing the lowest density. The higher the density the lighter the colour becomes.

