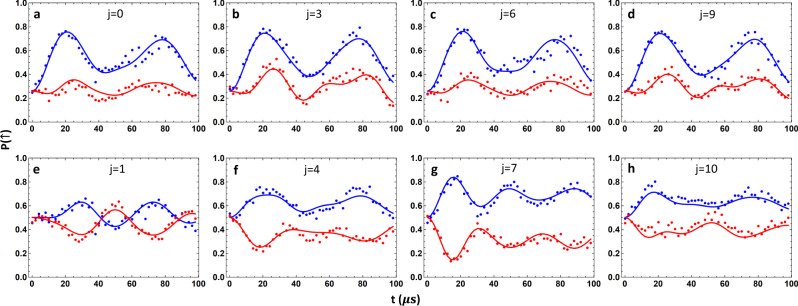
Fig. 4. Measuring ground state supercharges.
We reconstruct the phonon density matrix with the spin projected to σz = ±1 or σy = ±1 by maximum-likelihood estimation. a–d The measured spin dynamics under blue-sideband (blue dots) and red-sideband (red dots) driving and those predicted by the best-fitted density matrix (blue and red curves) for |ψ−〉 after four typical phonon displacements with σz projected to ±1. Each data point is the average of 400 experimental shots, half of which have a σz gate before the measurement sequence to remove the off-diagonal spin terms. e–h Similar plots for |ψ−〉 after four typical phonon displacements with σy projected to ±1. Here, we choose ω = 2π × 10 kHz and gm = 2π × 5.43 kHz. The displacement operators D(βj) are characterized by where β = 0.687, N = 12 and j = 0, 1, …, N − 1. The complete data for all the displacements and both |ψ−〉 and |ψ+〉 are presented in Supplementary Note 2. From the fitted density matrices, we get 〈σz ⊗ A〉 = 0.201 ± 0.013 and 〈σy ⊗ B〉 = 0.300 ± 0.009 for |ψ−〉 and 〈σz ⊗ A〉 = −0.163 ± 0.017 and 〈σy ⊗ B〉 = −0.349 ± 0.011 for |ψ+〉 where error bars are estimated by Monte Carlo sampling (see Methods).

