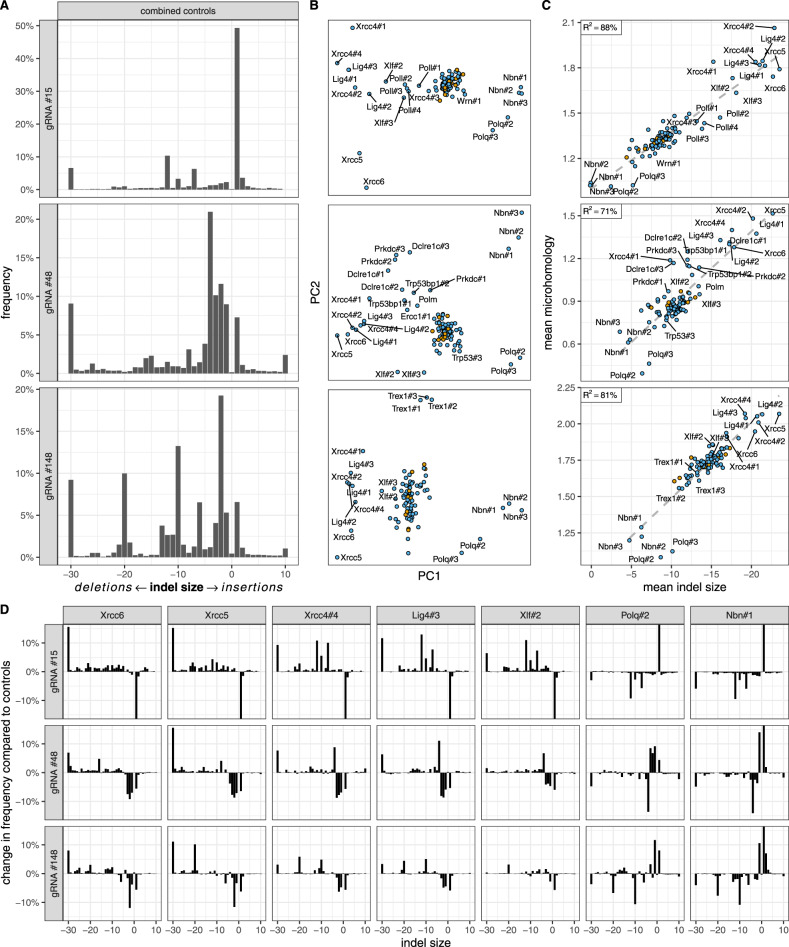
Fig. 2. Core end joining genes influence indel profiles globally.
A Indel profiles in combined 12 control samples. B Relationships between cell clones based on their indel profiles. Clones significantly different from controls in both replicates are labeled (FDR-corrected p < 0.01 from a chi-squared distribution, see Methods). The arrangement of non-significant clones is in Supplementary Fig. 3C. C Correlation between mean indel size and microhomology. D Relative frequencies of indel sizes compared to controls in deficient clones with a significant impact on all three gRNAs. Indel profiles of other clones with significant impact are in Supplementary Fig. 6. Y axis is truncated at −15% and +15%. In panels (A) and (D), indel frequencies are aggregated by combined size. Negative numbers represent deletions and positive ones represent insertions. The leftmost and rightmost bars (−30 and 10) combine all larger deletions and insertions, respectively. Biological replicates (N = 2) were averaged for clarity. All rows in panels (B) and (C) relate to the same gRNAs as in panel (A). In panels (B) and (C), controls are in orange and samples are in blue.

