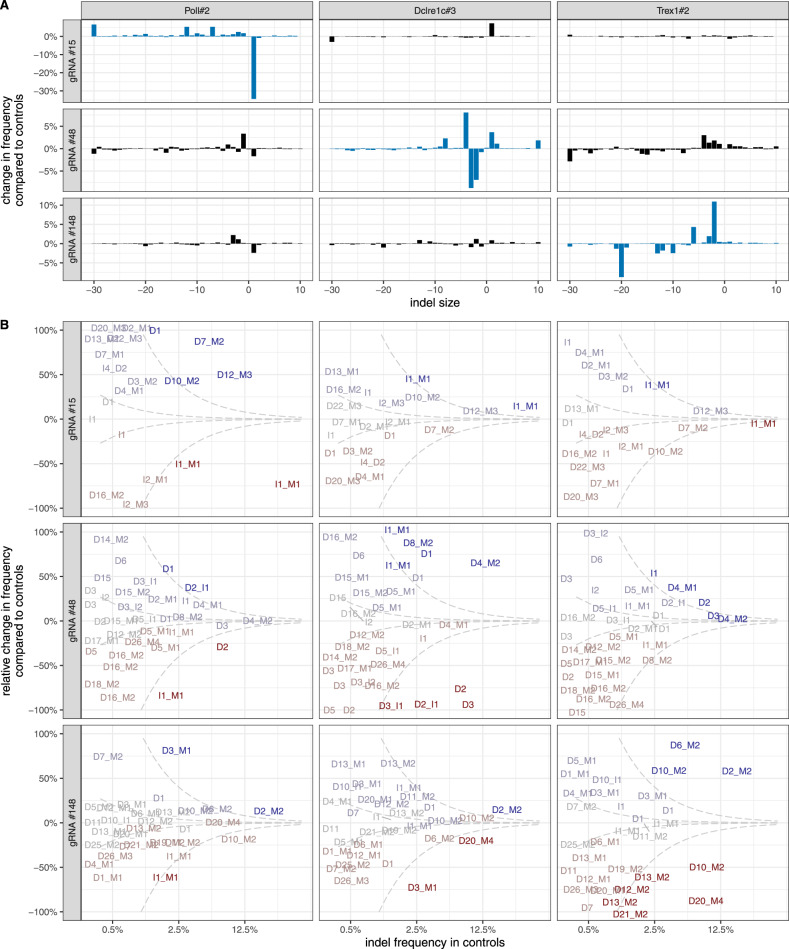
Fig. 3. Deficiencies in specialized DNA damage repair genes influence indel profiles in a locus-specific manner.
A Indel profile divergence between controls and selected clones. Blue bars highlight clone/gRNA combinations that were significantly affected (FDR-corrected p < 0.01 from a chi-squared distribution, see Methods). B Change in frequency of individual indels relative to controls. 'D' = deletion, 'I' = insertion, 'M' = microhomology (see Methods). X axis indicates the frequency in control clones. Y axis indicates relative change in indel frequency in a given clone relative to control clones. Complete loss of the indel is at −100%, while 100% indicates doubled frequency. The axis is truncated there for display clarity. Only indels present at 0.3% frequency or higher in control clones are shown. Dashed lines indicate absolute change of 0.1% and 1% respectively, color gradations highlight this change. Biological replicates (N = 2) were averaged for clarity. All columns relate to the same gRNAs as in panel (A).

