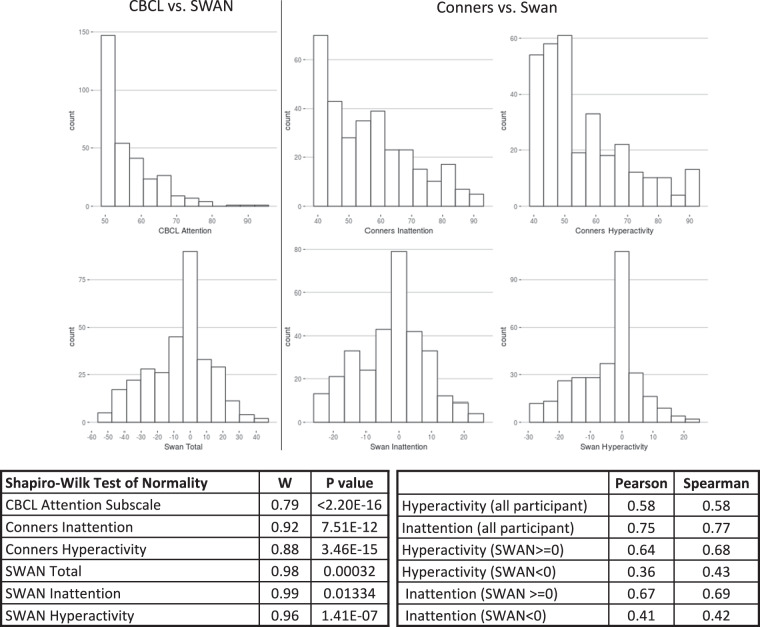
Fig. 4.
Distribution of attention ratings. Total CBCL Attention subdomain distribution compared to total SWAN distribution (left column). Distributions of Conners Inattention compared to SWAN Inattention (middle column) and Conners Hyperactivity compared to SWAN Hyperactivity (right column). The distribution of each scale was tested for normality using the Shapiro-Wilk test. Finally, Pearson (r) and Spearman (p) correlations between the SWAN and Conners are represented for both the hyperactivity and inattention subscales for all participants, those with SWAN > = 0, and participants with SWAN <0.

