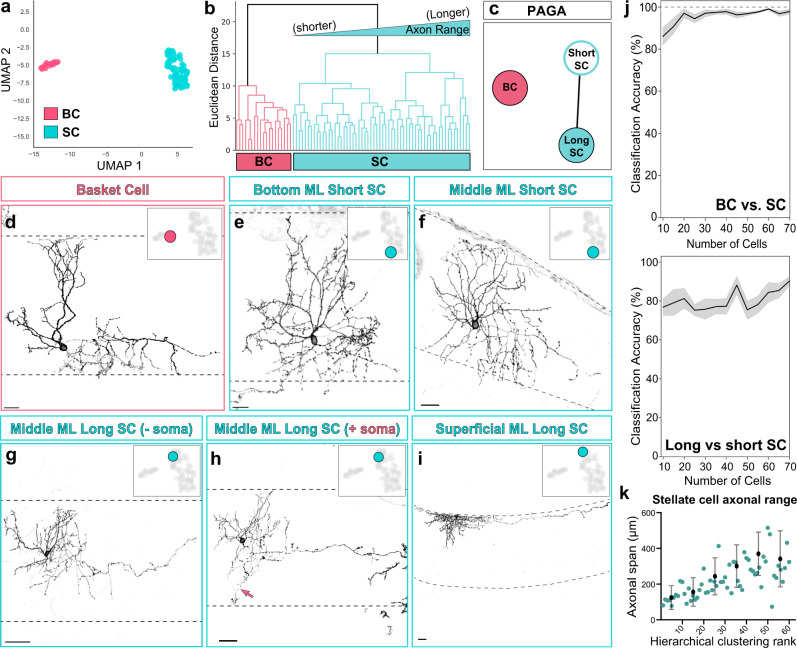
Fig. 2. Clustering of mature MLI morphologies reveals discrete and continuous heterogeneity.
a UMAP plot separates 79 mature MLI morphological reconstructions into discrete basket (BC, pink) and stellate cell (SC, teal) clusters. Each data point represents a single MLI based on morphometric measurements. b Hierarchical clustering separates MLIs into two BC (pink) and SC (teal) clades. Within the broad SC cluster, the dendrogram ordered MLIs from shorter to longer axonal range cells. c PAGA separates MLIs into discrete BC and SC clusters. SCs are subdivided into two nodes connected through an edge, denoting continuous variation in morphology. d–i Examples of MLIs and their locations within the UMAP manifold. ML boundaries are outlined by dashed lines. d MLI from the BC cluster displays canonical BC morphology. e An MLI at one pole of the SC cluster displays short-range axonal morphology and its soma resides within the lower ML. f An MLI plotted within similar coordinates of the UMAP manifold as e, displays short-range axonal morphology but resides within the middle ML. g An MLI at the opposite pole of the SC cluster displays long-range axonal morphology. h An MLI which resides within similar coordinates of the UMAP as g, extends descending PC soma-targeting axon collaterals (pink arrow at PC soma; axon terminal reaches the PC soma base). i An MLI located in the very superficial ML extends long axonal range collaterals. j Iterative clustering using random subsamples shows that MLI classification into BC/SC clades is robust, as cross-validation using as few as 20 subsampled cells replicates the BC/SC division. By similar measures, classification of SCs into long- and short-range subclades is not robust. Lines show means drawn from 20 trials for each sample size, with SEM represented by shaded regions. k Axonal span of SCs vary continuously from shorter-range to longer-range cells, ranked by hierarchical clustering rank. Error bars represent mean and SD of the data, n = 61 SCs in UMAP, 60 in hierarchical clustering; 18 BCs in UMAP, 19 in hierarchical clustering. Scale bars are 20 µm in d–f, 40 µm in g–i.

