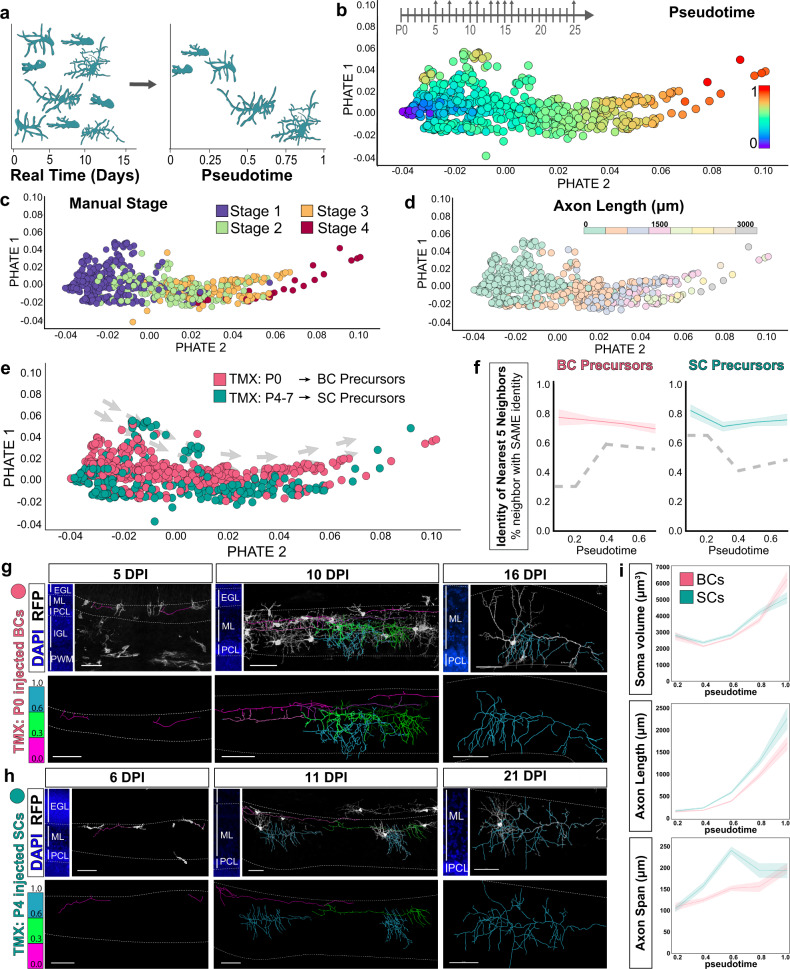
Fig. 8. PHATE trajectory inference reveals divergent m-type MLI identities during axonogenesis.
a Schematic depicting pseudotime trajectory inference. Ordering cells and their maturation by animal age (left) is complicated by the developmental variability within any given time point. Pseudotime orders snapshots of developing neurons by morphological maturity (right). b PHATE-generated pseudotime ordering of 732 developing MLI morphologies. Each data point represents the developmental morphometry of one MLI reconstruction and color-coded by pseudotime stage. c Validation of PHATE ordering by projecting expert-directed maturity for each cell. d Projection of total axonal lengths onto PHATE manifold. e Projection of inferred MLI identity based on TMX-induced lineage tracing: BC, early-born identity (P0 TMX; n = 423 cells; pink) or SC, late-born identity (P4–P7 TMX; n = 309 cells; teal) from N = 32 mice. f Nearest 5 neighbors were obtained for each cell in the PHATE coordinate space. Proportion of neighbors with the same identity were plotted for BC (left) and SC (right) m-type identities. Line plot shows mean with shaded lines for SEM. Dashed gray line represents the null distribution within each pseudotime bin. For pseudotime 0–0.2: p < 0.0001 (BCs) and p < 0.05 (SCs); 0.2–0.4: p < 0.01 (BCs) and p < 0.001 (SCs); 0.4–0.6: p < 0.05 (BCs) and p < 0.0001 (SCs); 0.6–0.8: p < 0.001 (BCs) and p < 0.0001 (SCs) based on one-way t-test. g Confocal images show progression of axon morphogenesis of P0-injected RFP-labeled MLIs (greyscale) at 5, 10, 16 days post injection (DPI). Cerebellar layers are marked by DAPI (blue, left). Axon arbor reconstructions are colorized based on the cell’s PHATE pseudotime maturity (magenta cells, 0–0.29; green cells, 0.3–0.59; teal cells, 0.6+). h Pseudotime annotation of late-born MLIs, similar to g. i Line plots of individual morphometric measurements along pseudotime show differences in soma volume, axon length and horizontal axon span between BC- and SC-fated populations (mean ± 95% CI). Scale bars are 50 µm. EGL external granule layer, PWM prospective white matter.

