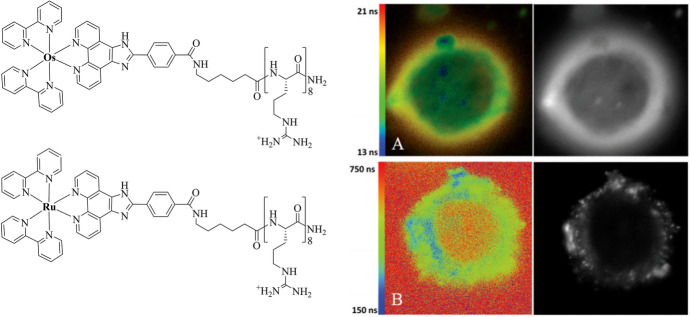
Fig. 11.
Phosphorescence lifetime imaging of A [Os(bpy)2(pic-R8)]10+ (70 μM/24 h) and B [Ru(bpy)2(pic-R8)]10+ (350 μΜ/15 min) in live SP2 cells. The false colour images and intensity mapping highlight the differences in emission lifetime of the luminophore depending on its localisation in the cell. The emission lifetime of the osmium(II) conjugate was 14.5 ± 0.5 ns in the cytoplasm and 18.8 ± 0.6 ns at the cell membrane. Reproduced from Ref. [131] with permission from the Royal Society of Chemistry

