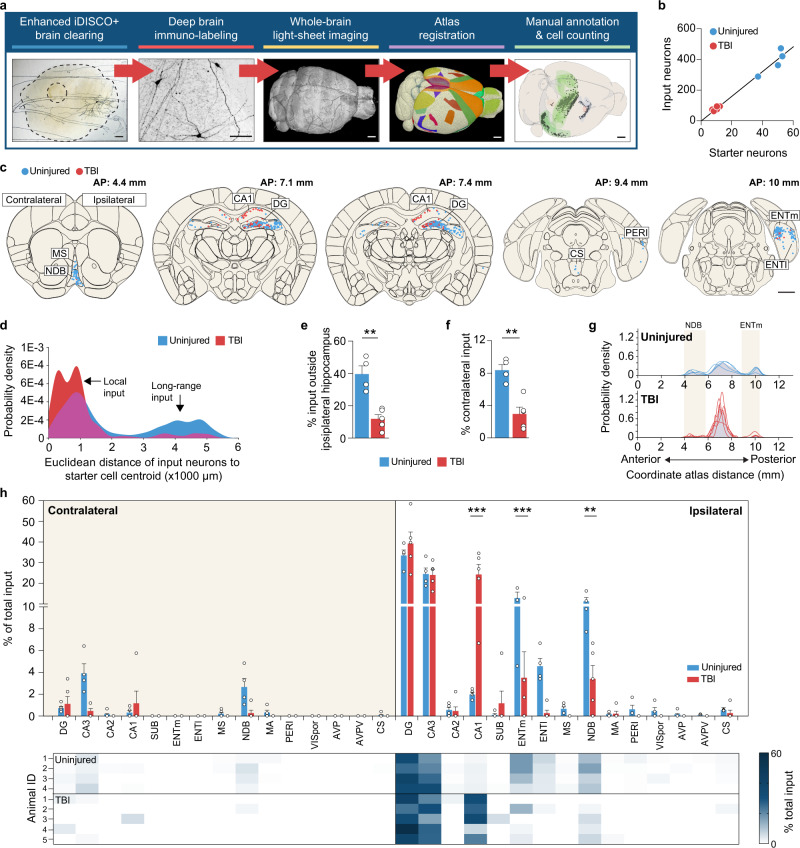
Fig. 2. Reorganization of brain-wide input to hippocampal SST interneurons after TBI.
a Experimental design for enhanced iDISCO+ brain clearing and whole-brain light-sheet imaging. b Linear regression analysis for number of starter cells and pre-synaptic input neurons in the whole brain (n = 4 uninjured controls, 5 TBI mice; R2 = 0.98). c Schematic coronal sections (250 μm) showing individual rabies-labeled cells registered in standardized atlas space for uninjured controls (blue) and brain-injured animals (red). One dot represents one neuron. n = 4 uninjured control and 5 TBI animals. A list of abbreviations is provided in Supplementary Data 2. d Gaussian kernel cell density plots showing pooled Euclidian distances of input neurons to nearest starter neuron centroid. e. Proportion of input neurons found outside ipsilateral hippocampus (DG, CA3, CA2, CA1). Uninjured: 39.6 ± 5.2%, n = 4 mice; TBI: 11.8 ± 2.7 %, n = 5 mice; **P = 1.5E-3; two-tailed t-test. f Proportion of input neurons found in the contralateral hemisphere. Uninjured: 8.4 ± 0.7%, n = 4 mice; TBI: 3.0 ± 0.8 %, n = 5 mice; **P = 2.0E-3; two-tailed t-test. g Gaussian kernel cell density plot of the whole-brain distribution of input neurons along the anterior-posterior axis. Grey shading represents the pooled population with individual lines representing each animal. Quantification is provided in Supplementary Data 3. h Proportion of input neurons found in each discrete brain area. ***P < 1.0E-15, uninjured versus TBI (CA1), ***P = 2.25E-04, uninjured versus TBI (ENTm), **P = 4.69E-03, uninjured versus TBI (NDB); two-way repeated-measures ANOVA with Bonferroni’s post-hoc test; n = 4 uninjured and 5 TBI mice. Quantification is provided in Supplementary Data 4. Error bars, s.e.m.; scale bars, 1 mm (except deep immunolabeling in a, 100 μm). See also Supplementary Figs. 3 to 7, Supplementary Data 5, and Supplementary Movies 1 and 2. Source data are provided as a Source Data file.

