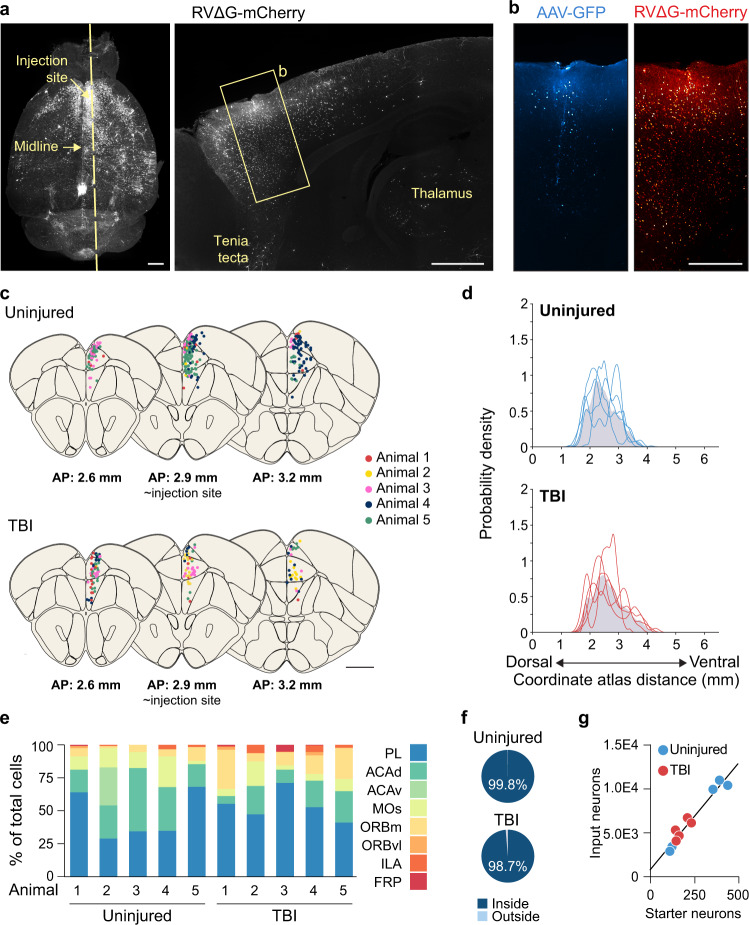
Fig. 5. Distribution of starter neurons in PFC.
a Left: Whole brain cleared using iDISCO+ and labeled for neurons providing input to PFC SST interneurons (white). Right: 100 μm sagittal optical section of the same brain showing rabies-labeled input neurons at the injection site. b Boxed region shown in (a) labeled for starter cells (blue) and input neurons (red). c. Schematic coronal sections (100 μm) showing individual starter cells registered in standardized atlas space for uninjured controls and brain injured animals. Each color corresponds to a different animal. One dot represents one neuron. n = 5 animals per group. d Gaussian kernel cell density plots of the whole-brain distribution of starter neurons along the dorsal-ventral axis. Grey shading represents the pooled population with individual lines representing each animal. e Regional distribution of starter cells in uninjured controls and brain injured animals. f Proportion of starter cells identified within PFC (PL, ACAd, ACAv, MOs, ORBm, ORBvl, ILA). g Linear regression analysis for number of starter cells and pre-synaptic input neurons (n = 5 mice per group; R2 = 0.95). Scale bars, 1 mm (a and c), 500 μm (b). A list of abbreviations is provided in Supplementary Data 2. See also Supplementary Fig. 9 to 12. Source data are provided as a Source Data file.

