
Figure 2. Exhausted CD8+ T cells express myeloid-related factors.
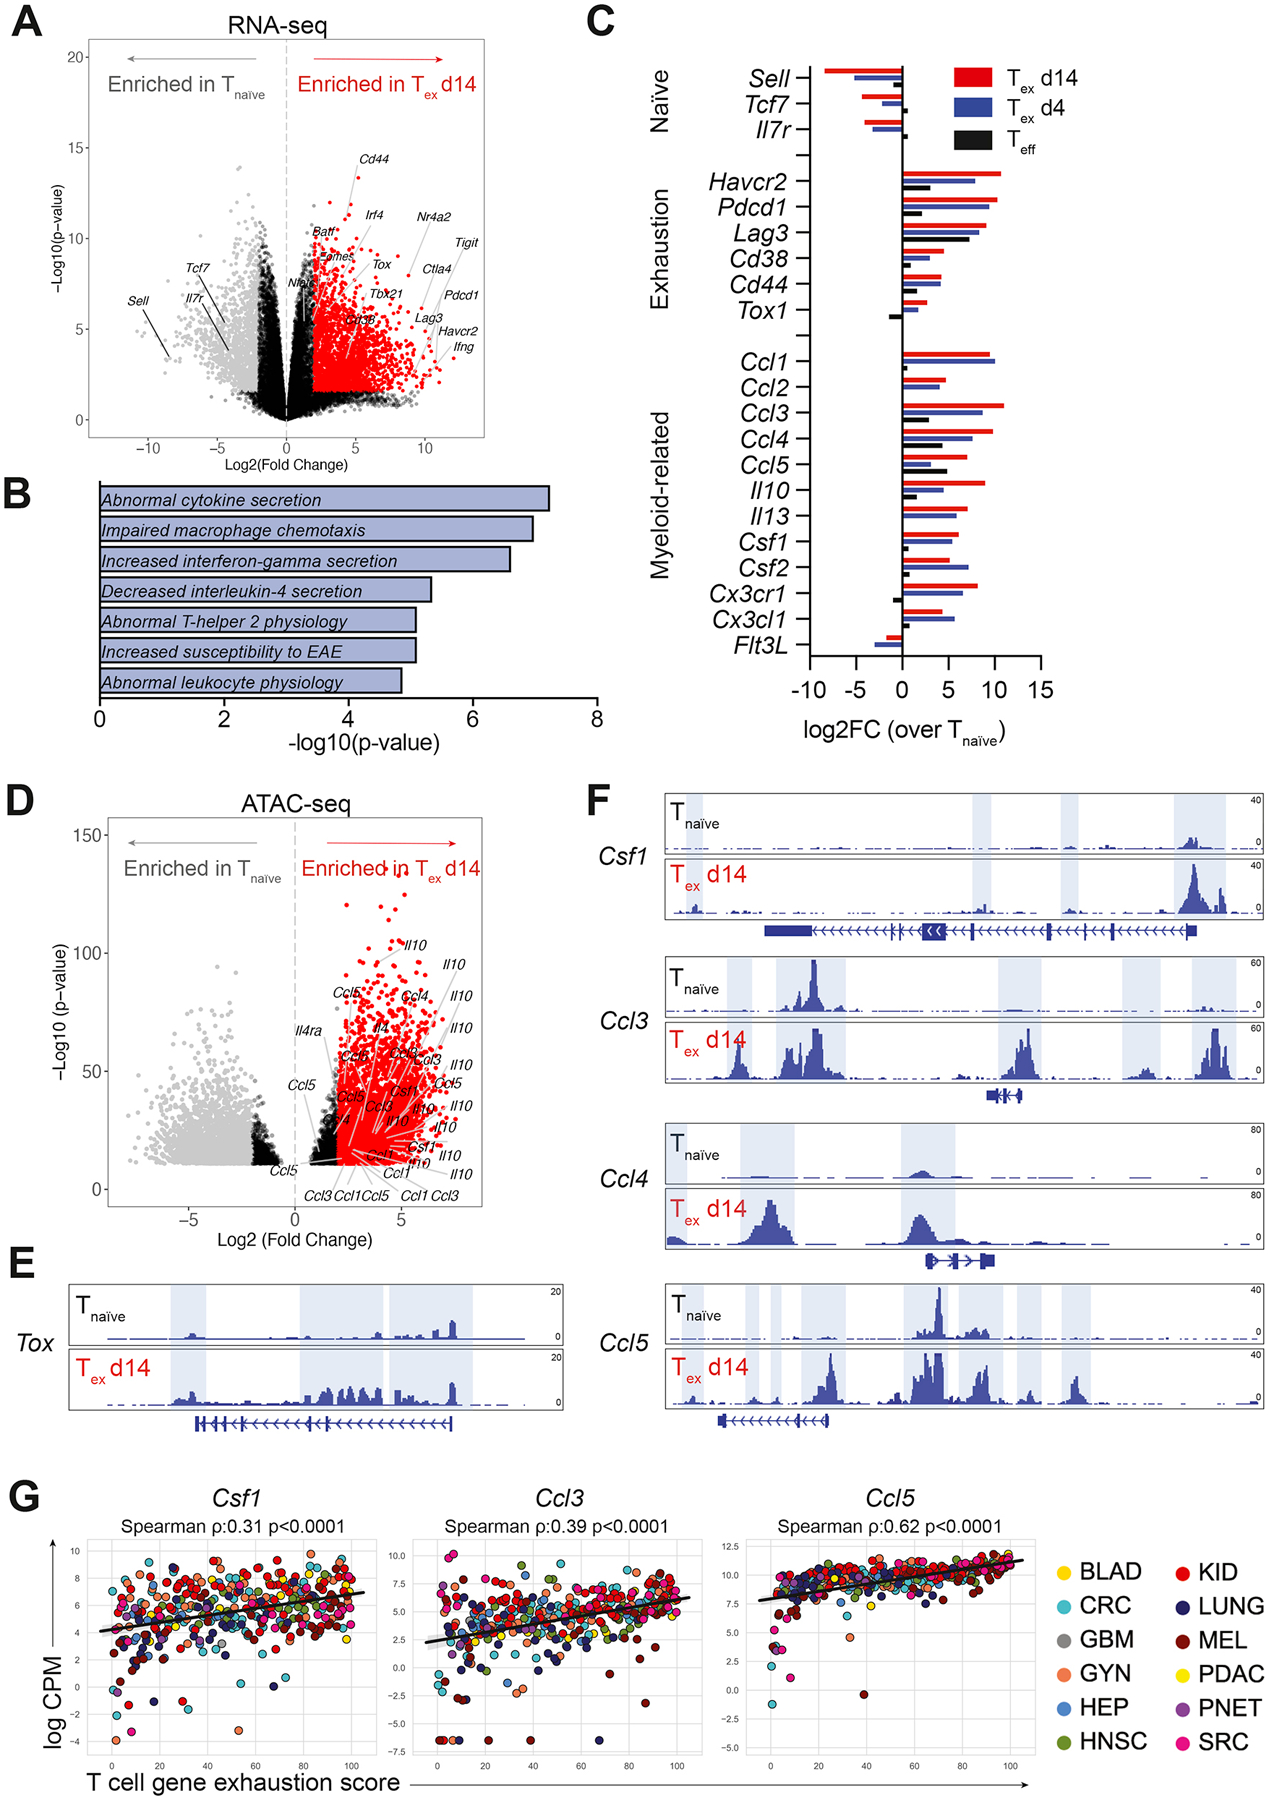
A) Volcano plot showing differential gene expression in tumor-infiltrating CD44+ OT-I CD8+ Tex d14 cells (red) compared to splenic CD44− OT-I CD8+ Tnaïve cells (grey) by RNA-seq. Colored dots (grey and red) represent genes with a log2FC>2 and FDR<0.05. B) Gene set enrichment analysis of DEGs (log2FC>5 and p-value<0.05) enriched in Tex d14 versus Tnaïve using the MGI Mammalian Phenotype Level 4 library. C) Average gene expression in Teff (black), Tex d4 (blue) and Tex d14 (red) normalized to Tnaïve as determined by RNA-seq. D) Volcano plot showing differential chromatin accessibility at transcriptional start sites in loci of myeloid genes in tumor-infiltrating CD44+ OT-I CD8+ Tex d14 cells compared to splenic CD44− OT-I CD8+ Tnaïve cells by ATAC-seq. Colored dots (grey and red) represent genes with a log2FC>2 and FDR<0.05. E-F) ATAC-seq signal tracks at the Tox (E), Csf1, Ccl3, Ccl4 and Ccl5 loci (F) highlighting differential chromatin accessibility peaks in CD44+ OT-I CD8+ Tex cells (d14) compared to splenic CD44− OT-I CD8+ Tnaïve cells. G) Correlation of normalized expression of Csf1, Ccl3 and Ccl5 transcripts and exhaustion score in FACS sorted human intratumoral T cells across multiple human cancer indications. See also Figure S2.