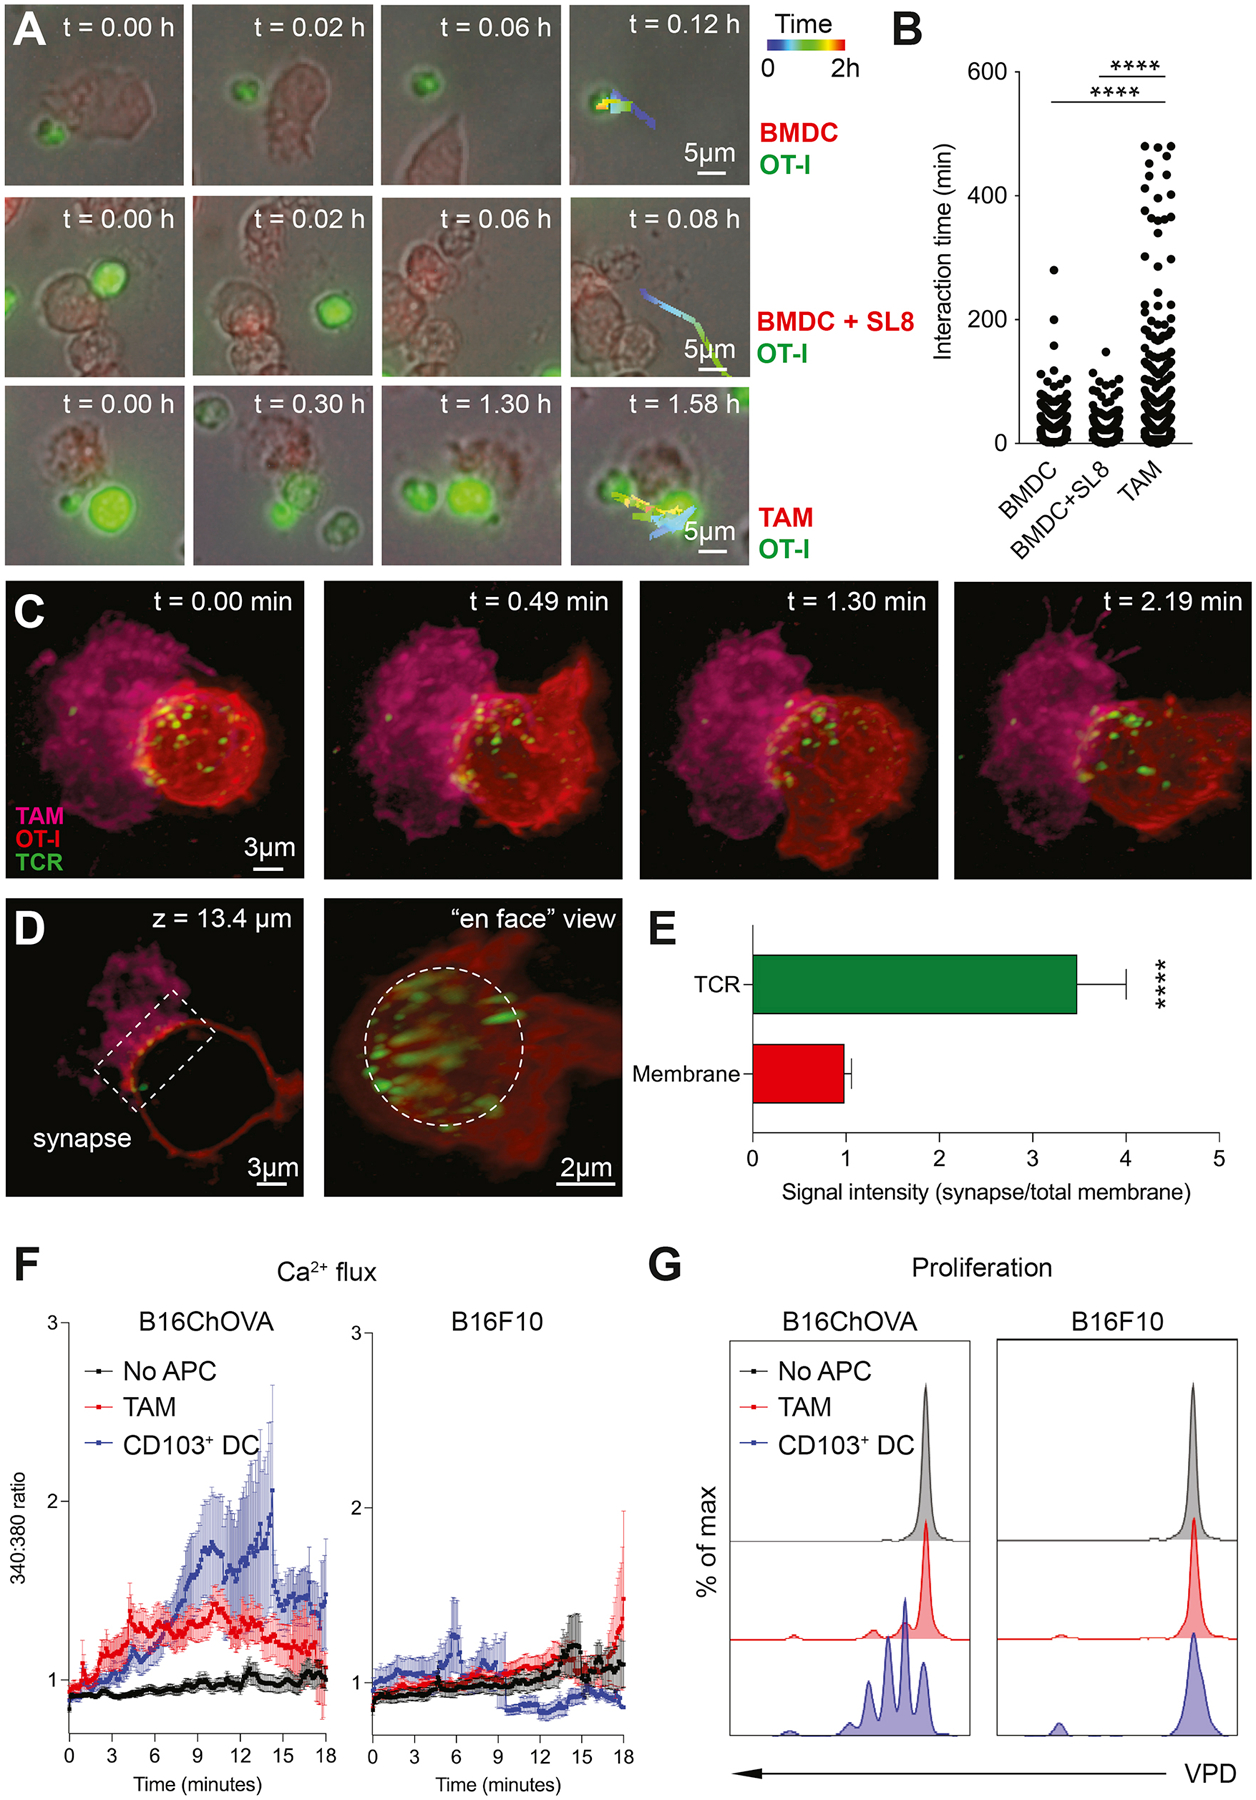
Figure 4. TAM uniquely engage CD8+ T cells in antigen-specific long-lived synaptic interactions.

A) Representative images of ex vivo interactions between mTomato+ APC (BMDC, BMDC+SL8 or B78ChOVA-derived TAM) and CFSE-labeled previously activated CD8+ OT-I T cells over time using conventional wide field microscopy. B) Quantification of interaction time. n = 3452 TAM, n = 6134 BMDC, n = 3320 BMDC+SL8. Statistical significance was determined using the one-way ANOVA test with Holm-Sidak’s multiple comparison correction. C) Representative images of the interaction between mTomato+ TAM sorted from B78ChOVA melanomas (magenta) and previously activated CD8+ OT-I T cell labeled with CD45-AF647 (red), with the H57 TCRβ labeled with AF488 by lattice light sheet imaging. Scale bar, 3μm. D) Z-slice (left) and ‘en face’ view (right) of the TAM-CD8+ T cell interaction site showing TCR clustering in the immunological synapse (box (left) and dotted circle (right)). E) Quantification of polarized TCR clustering by determining the ratio of signal intensity of the red (membrane) or green channel (TCR) at the synapse site normalized to the entire membrane. N = 12 T cells. Statistical significance was determined using the Mann-Whitney U test. F-G) Quantification of immediate Ca2+ flux by FURA-2AM imaging (F) and proliferation after 72 hours by dilution of Violet Proliferation Dye (VPD) (G) in previously activated CD8+ OT-I T cells after interaction with TAM or CD103+ DC isolated from B16ChOVA or B16F10 tumors. Negative control represents CD8+ OT-I T cells that did not touch an APC (no APC). All data are mean ± SEM. * p < 0.05, ** p < 0.01, *** p < 0.001, **** p < 0.0001. See also Movie S1 and Figure S4.
