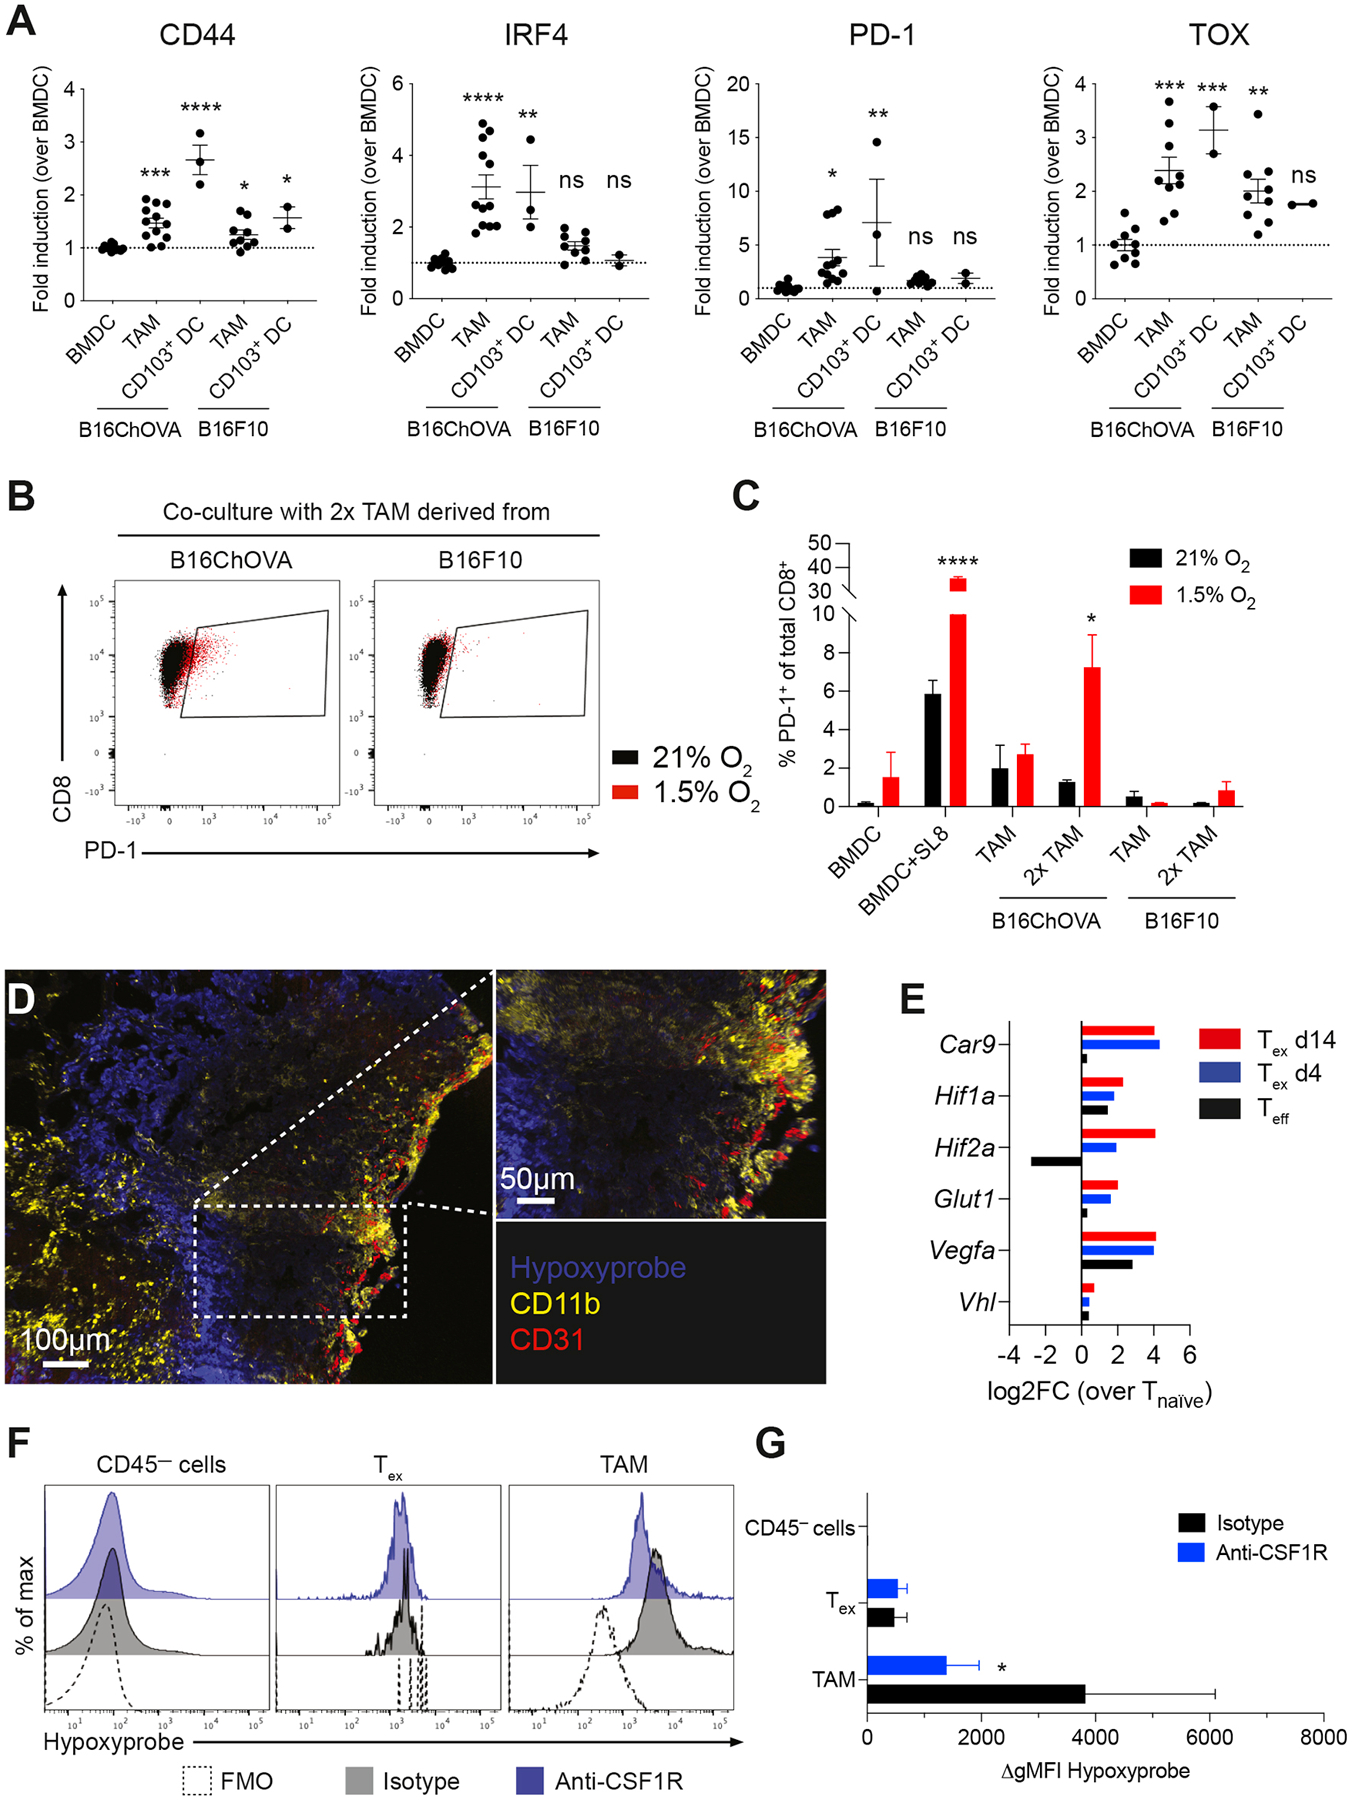
Figure 5. TAM engagement contributes to induction of exhaustion programs in CD8+ T cells in an antigen-specific manner.

A) Flow cytometric analysis of CD44, IRF4, PD-1 and TOX expression in previously activated CD8+ OT-I T cells co-cultured for 72 hours with in vitro generated BMDC, and TAM or CD103+ DC isolated from B16ChOVA or B16F10 tumors. Data presented as fold induction over BMDC. Cumulative data from 4 independent experiments. All data are plotted as mean ± S.E.M. One-way ANOVA with Holm-Sidak correction for multiple comparisons. B-C) Representative dot plots (B) and quantification (C) of PD-1+ expression on previously activated CD8+ OT-I T cells after co-culture with in vitro generated BMDC±SL8, and TAM isolated from B16ChOVA or B16F10 tumors. Ratio of APC:T cell was 1:4 or 1:2 (2x TAM). Plates were incubated in normoxic (21% O2) and hypoxic (1.5% O2) conditions for 3 days. Statistical significance was determined using the Unpaired t-test. D) Immunofluorescence of B78ChOVA melanomas stained with pimonidazole (Hypoxyprobe) Pacific Blue, CD11b-AF594 (yellow) and CD31-AF647 (red). E) Average expression of hypoxia-related genes in Teff (black), Tex d4 (blue) and Tex d14 (red) normalized to Tnaïve as determined by RNA-seq. F-G) Representative histograms (F) and quantification (G) of hypoxyprobe staining in CD45— cells, CD44+ OT-I CD8+ T cells and CD11b+F4/80+ TAM in B78ChOVA melanomas treated with isotype (black) or anti-CSF1R antibodies (blue). Statistical significance was determined using the Mann-Whitney U test. N = 4–5 mice/group. Representative of two independent experiments. All data are mean ± SEM. * p < 0.05, ** p < 0.01, *** p < 0.001, **** p < 0.0001. See also Figure S5.
