
Figure 6. Spatial delineation of TAM-Tex interaction dynamics in the TME.
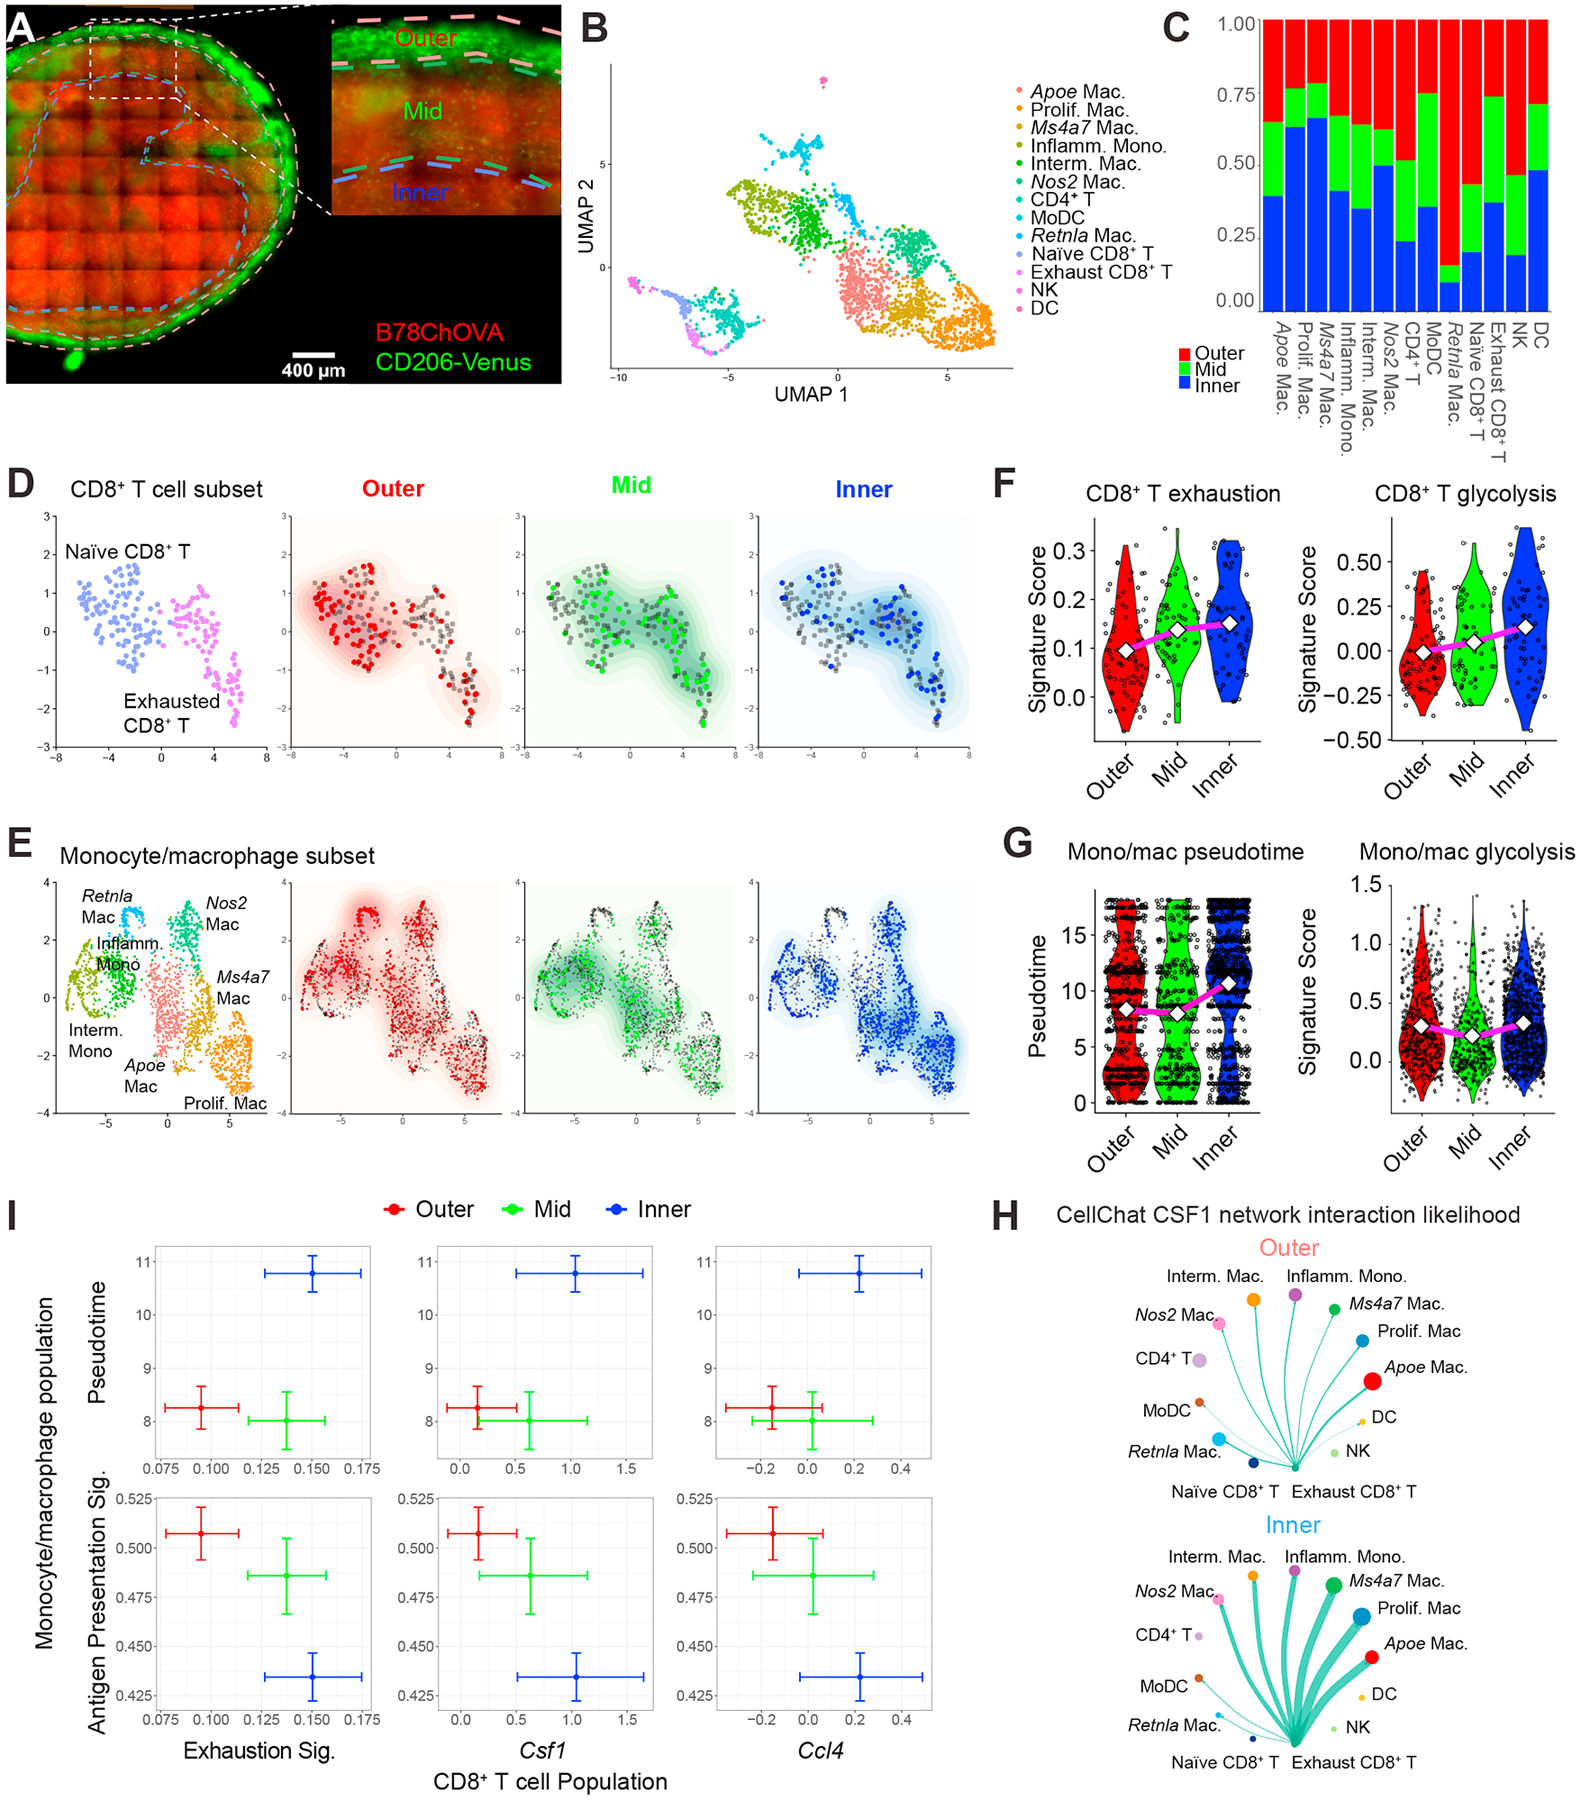
A) Imaging of a 150μm-thick live B78ChOVA melanoma section with ROI demarcation of outer, mid and inner compartments used for subsequent ZipSeq. Red channel denotes mCherry signal from B78ChOVA cancer cells and green channel indicates expression of mVenus in CD206+ macrophages in the Csf1RCre;LSL-Cd206-Venus-DTR mouse model. Scale bar = 400μm. B) UMAP representation of sorted CD45+ cells following 10X Genomics scRNA-seq workflow (n = 2765 cells with n = 427/394/335/288/275/244/220/170/120/108/91/62/31 for clusters as listed). C) Stacked bar charts representing regional distribution of distinct populations identified in B. D-E) UMAP of subsampled CD8+ T cell subset (n = 199 cells) (D) and monocyte/macrophage subset (n = 2083 cells) (E) overlaid with their regional localization. F) Violin plots representing CD8+ T cell exhaustion score (left; Outer: 0.31 / 0.10 / −0.07; Mid: 0.35 /0.14 / −0.05; Inner: 0.32 / 0.15 / −0.01) and CD8+ T cell glycolytic score (right; Outer; 0.45 / −0.01 / −0.37; Mid: 0.60 / 0.05 / −0.31; Inner: 0.69 / 0.14 / −0.45) in distinct regions in the TME. Values max / average (diamond) /min. G) Violin plots representing monocyte/macrophage pseudotime signature score (left; Outer: 18.1 / 8.3 /0.00; Mid: 18.1 / 8.0 / 0.00; Inner: 18.1 / 10.0 / 0.00) and monocyte/macrophage glycolytic score (right; Outer: 1.35 / 0.29 / −0.33; Mid: 1.39 / 0.21 / −0.33; Inner: 1.39 / 0.33 / −0.33). Values max / average (diamond) / min. H) CellChat interaction likelihood analysis for CSF1 network in outer (top) and inner (bottom) regions of the TME. Thickness of green arrows represents interaction likelihood between populations. I) Cross-whisker plots comparing expression of exhaustion signature and normalized single gene (Csf1 and Ccl4) expression in CD8+ T cells (x-axis), and pseudotime score and antigen-presentation signature in the monocyte/macrophage population (y-axis) in distinct regions in the TME. Error bars represent 95% CI as computed by bootstrap resampling. See also Figure S6 and Table S1.