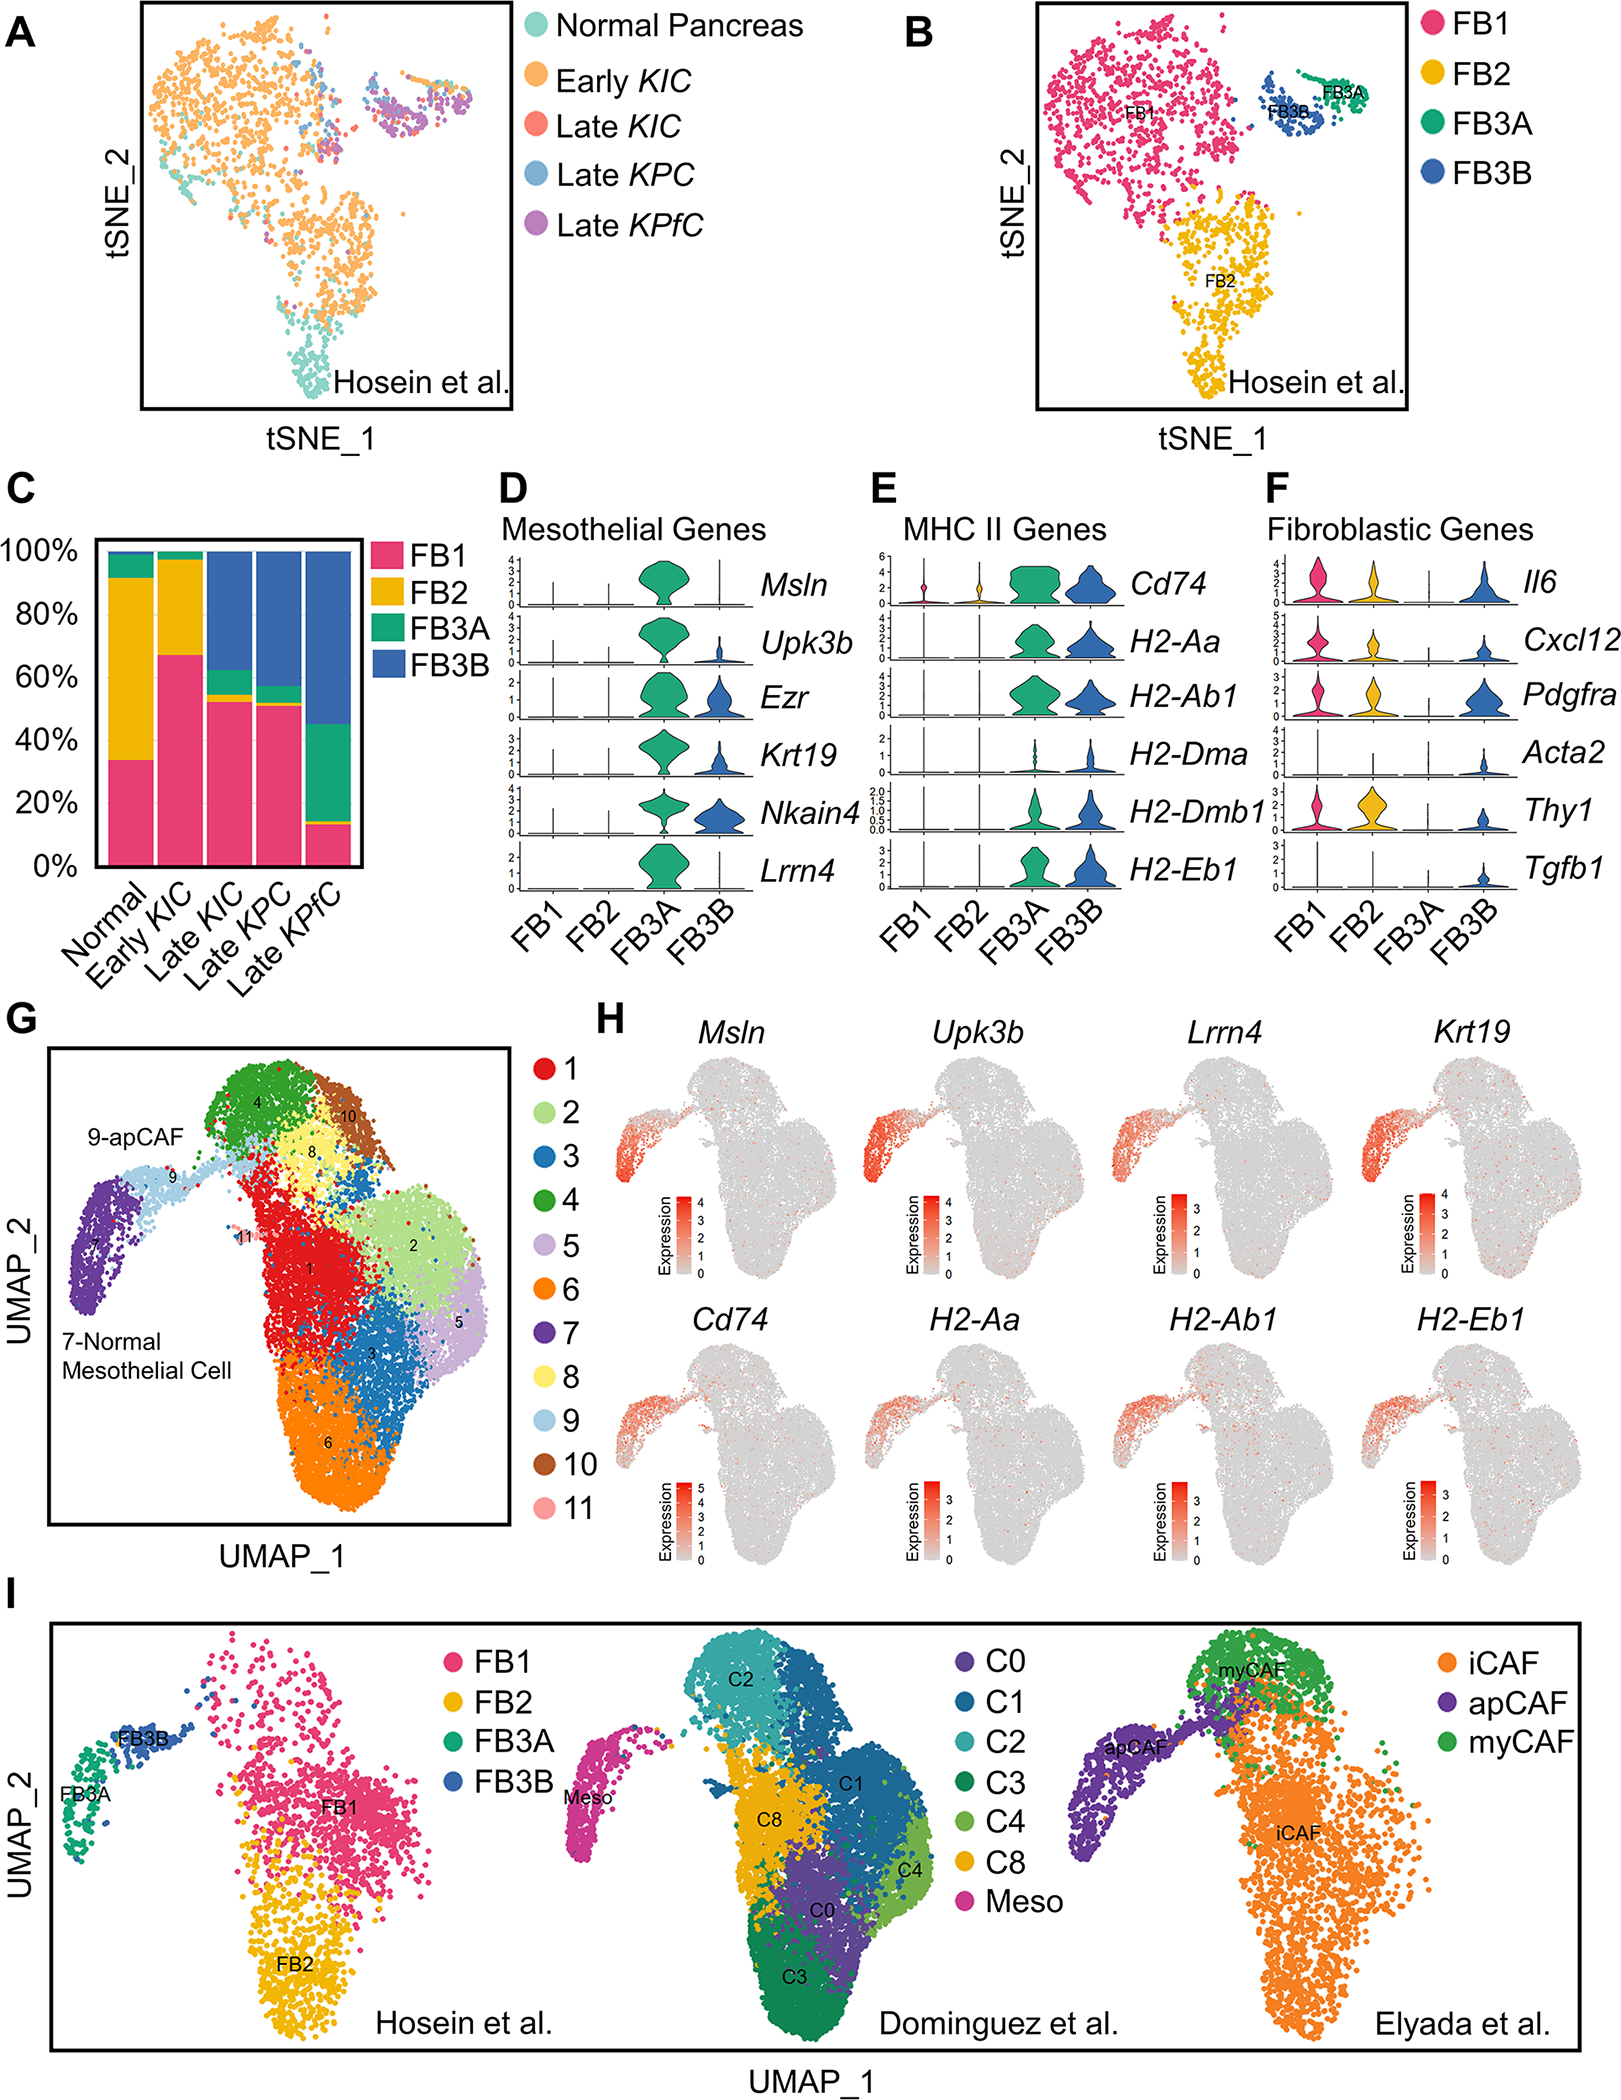
Figure 1. Relationship of Normal Mesothelial Cells and apCAFs in Integrated scRNA-seq Analyses.

(A-B) All fibroblasts from scRNA-seq of normal pancreas, early KIC, late KIC, late KPC and late KPfC tumor lesions projected onto a tSNE plot with each model (A) or the FB1, FB2, FB3A and FB3B fibroblast populations (B) distinguished by different colors.
(C) Proportions of different fibroblast populations in normal pancreas, early KIC, late KIC, late KPC and late KPfC tumor lesions.
(D-F) Violin plots demonstrating mesothelial (D), MHC II (E) and fibroblastic (F) genes for FB1, FB2, FB3A and FB3B fibroblast populations. The width of the violin plots represents frequency of cells in each region. Values of Y axis indicate log normalized expression of genes.
(G) Graph-based clustering of cells with UMAP was performed with the integrated data and 11 clusters of fibroblasts were identified.
(H) UMAP plots of mesothelial and MHC II genes from the integrated fibroblast data. Color keys indicate log normalized expression.
(I) Distribution of fibroblasts in the integrated data based on the origin of datasets (Dominguez et al., 2020; Elyada et al., 2019; Hosein et al., 2019), including FB1, FB2, FB3A and FB3B from Hosein et al. (Hosein et al., 2019), C0-C8 and normal mesothelial cell from Dominguez et al. (Dominguez et al., 2020) and iCAF, apCAF and myCAF from Elyada et al. (Elyada et al., 2019).
See also Figure S1.
