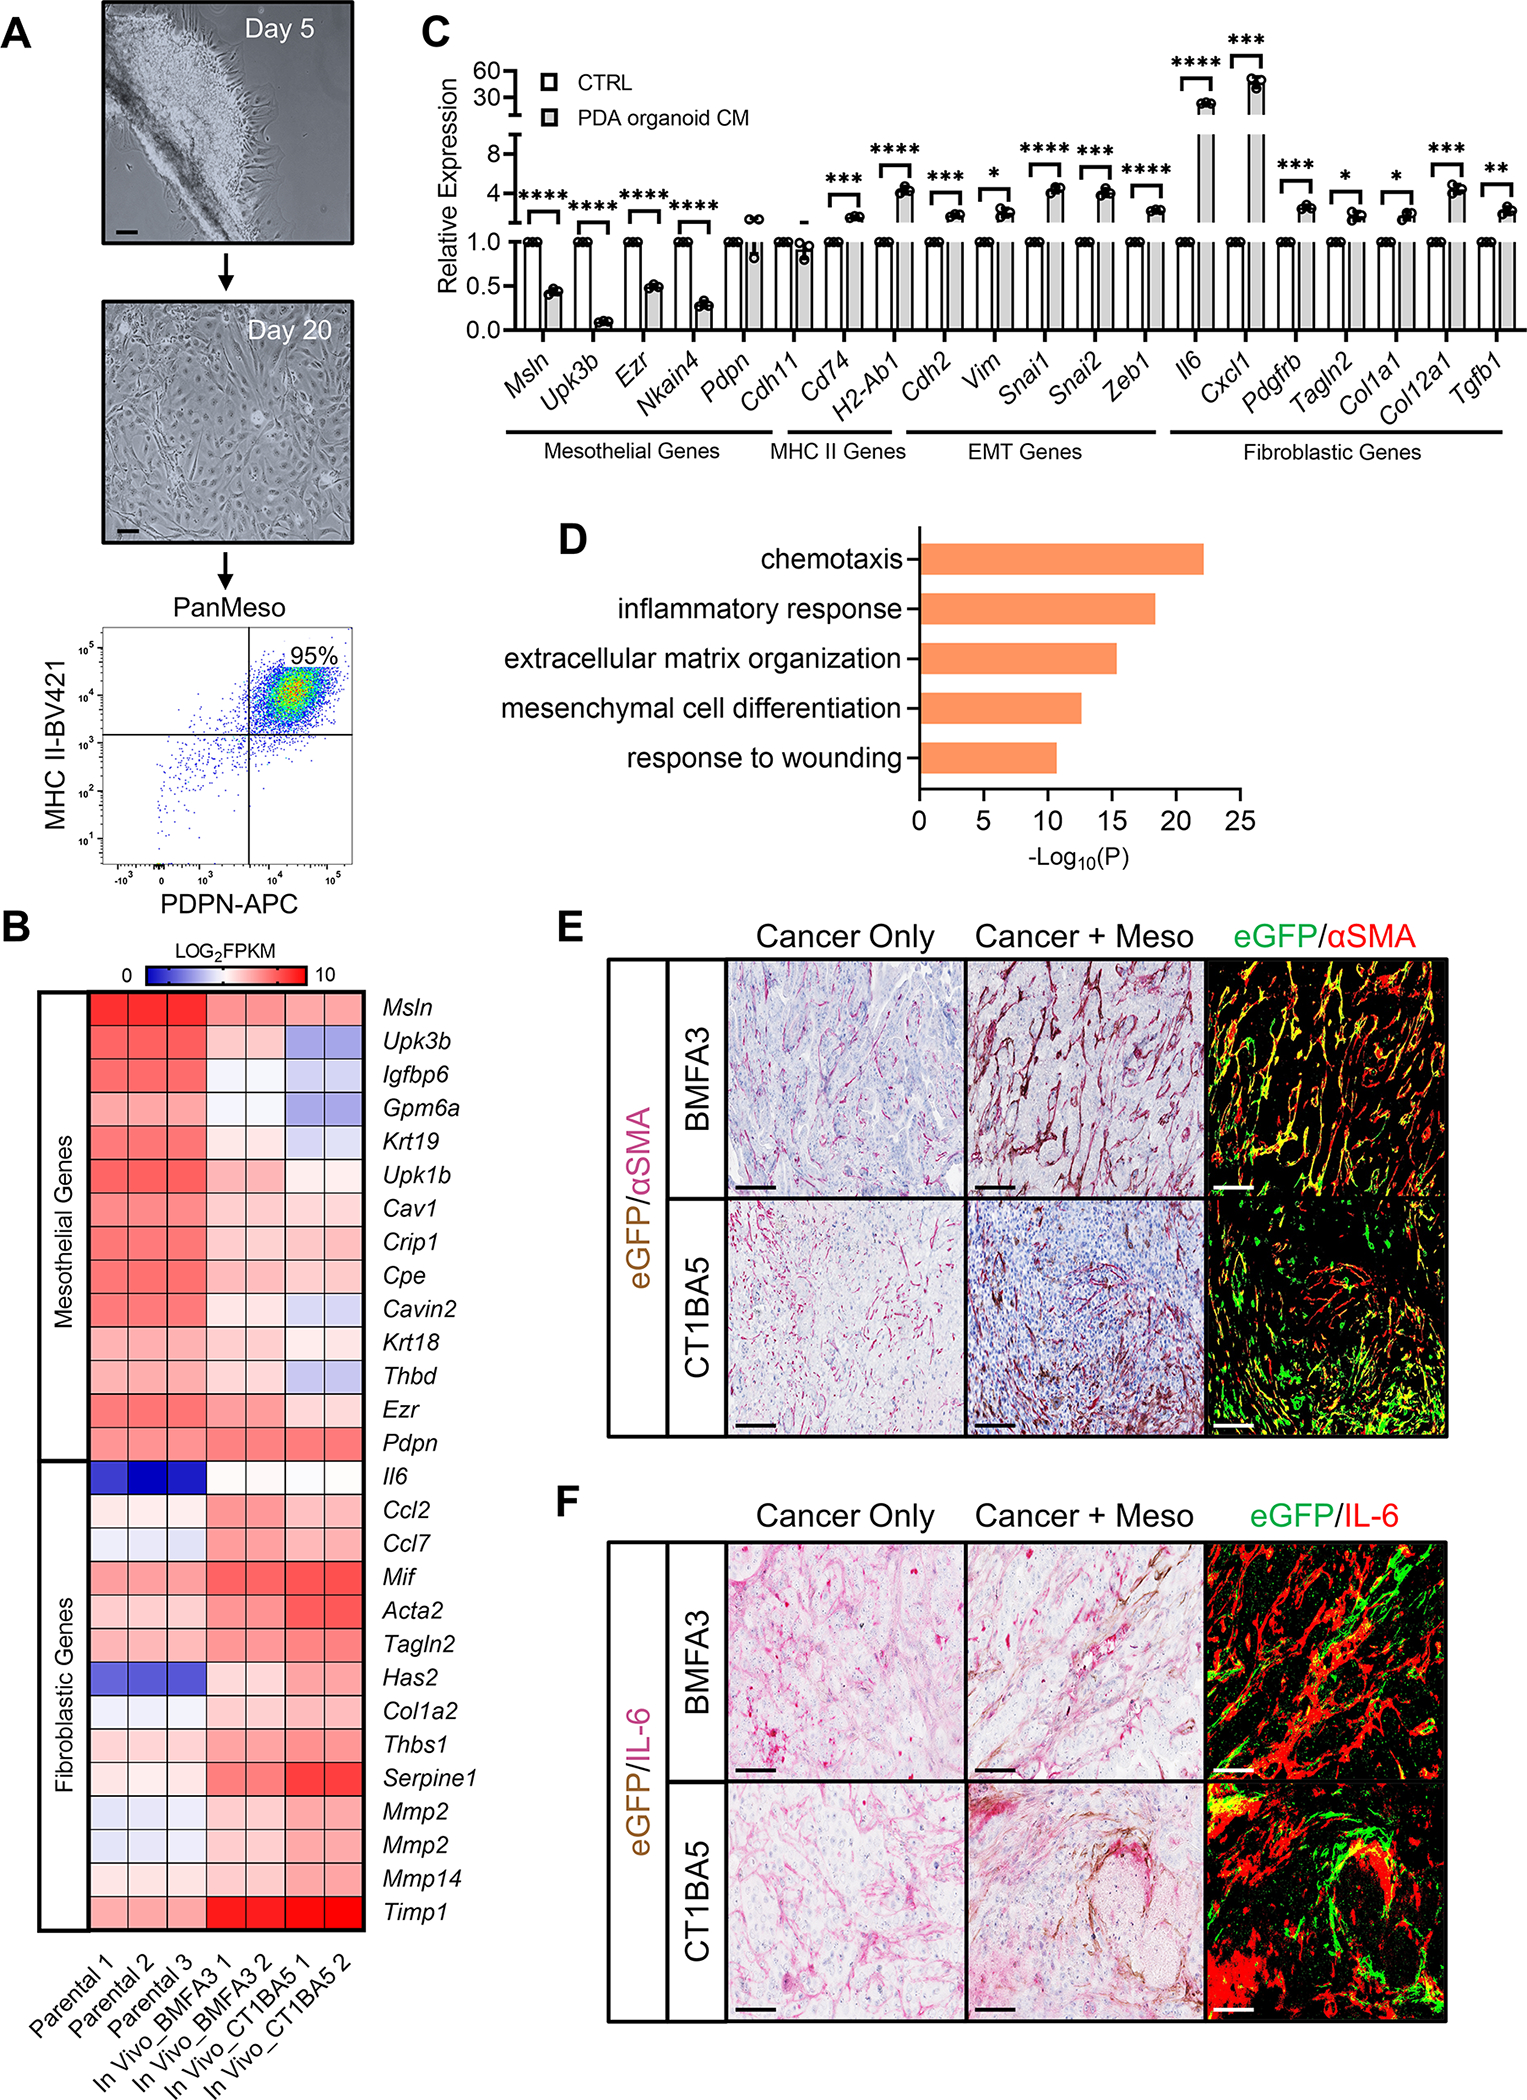
Figure 4. Recapitulating the Mesothelial Cell-apCAF Transition in PanMeso Cells.

(A) Day 5 and day 20 of pancreatic mesothelium tissues from immortomice were shown. Cells became confluent and were subjected to FACS. Podoplanin+MHC II+ cells were collected (PanMeso cells). Scale bar 50 μm.
(B) The heatmap generated from the RNA-seq data comparing mesothelial genes and fibroblastic genes between parental PanMeso cells and PanMeso cells sorted from BMFA3 or CT1BA5 tumors.
(C) The PanMeso cells were treated with PDA organoid conditioned medium derived from KPfC tumors for 48 hrs. Cells were harvested and subjected to qPCR for mesothelial, MHC II, EMT and fibroblastic genes. n=3, data shown as mean ± SD, statistical analysis, t-test, *P<0.05, **P<0.01, ***P<0.001, ****P<0.0001.
(D) Top biological processes of GO analysis with the up-regulated gene cluster in sorted compared with parental PanMeso cells (B) were shown.
(E-F) The tumors of (B) were fixed and stained for eGFP (brown) and the fibroblastic marker αSMA (red, E) or IL-6 (red, F). eGFP was also highlighted as green and αSMA or IL-6 was highlighted as red by ImageJ (right panel in E and F). Yellow marked the eGFP+ PanMeso cells expressing fibroblastic marker αSMA or IL-6. Scale bar 25 μm.
See also Figure S3.
