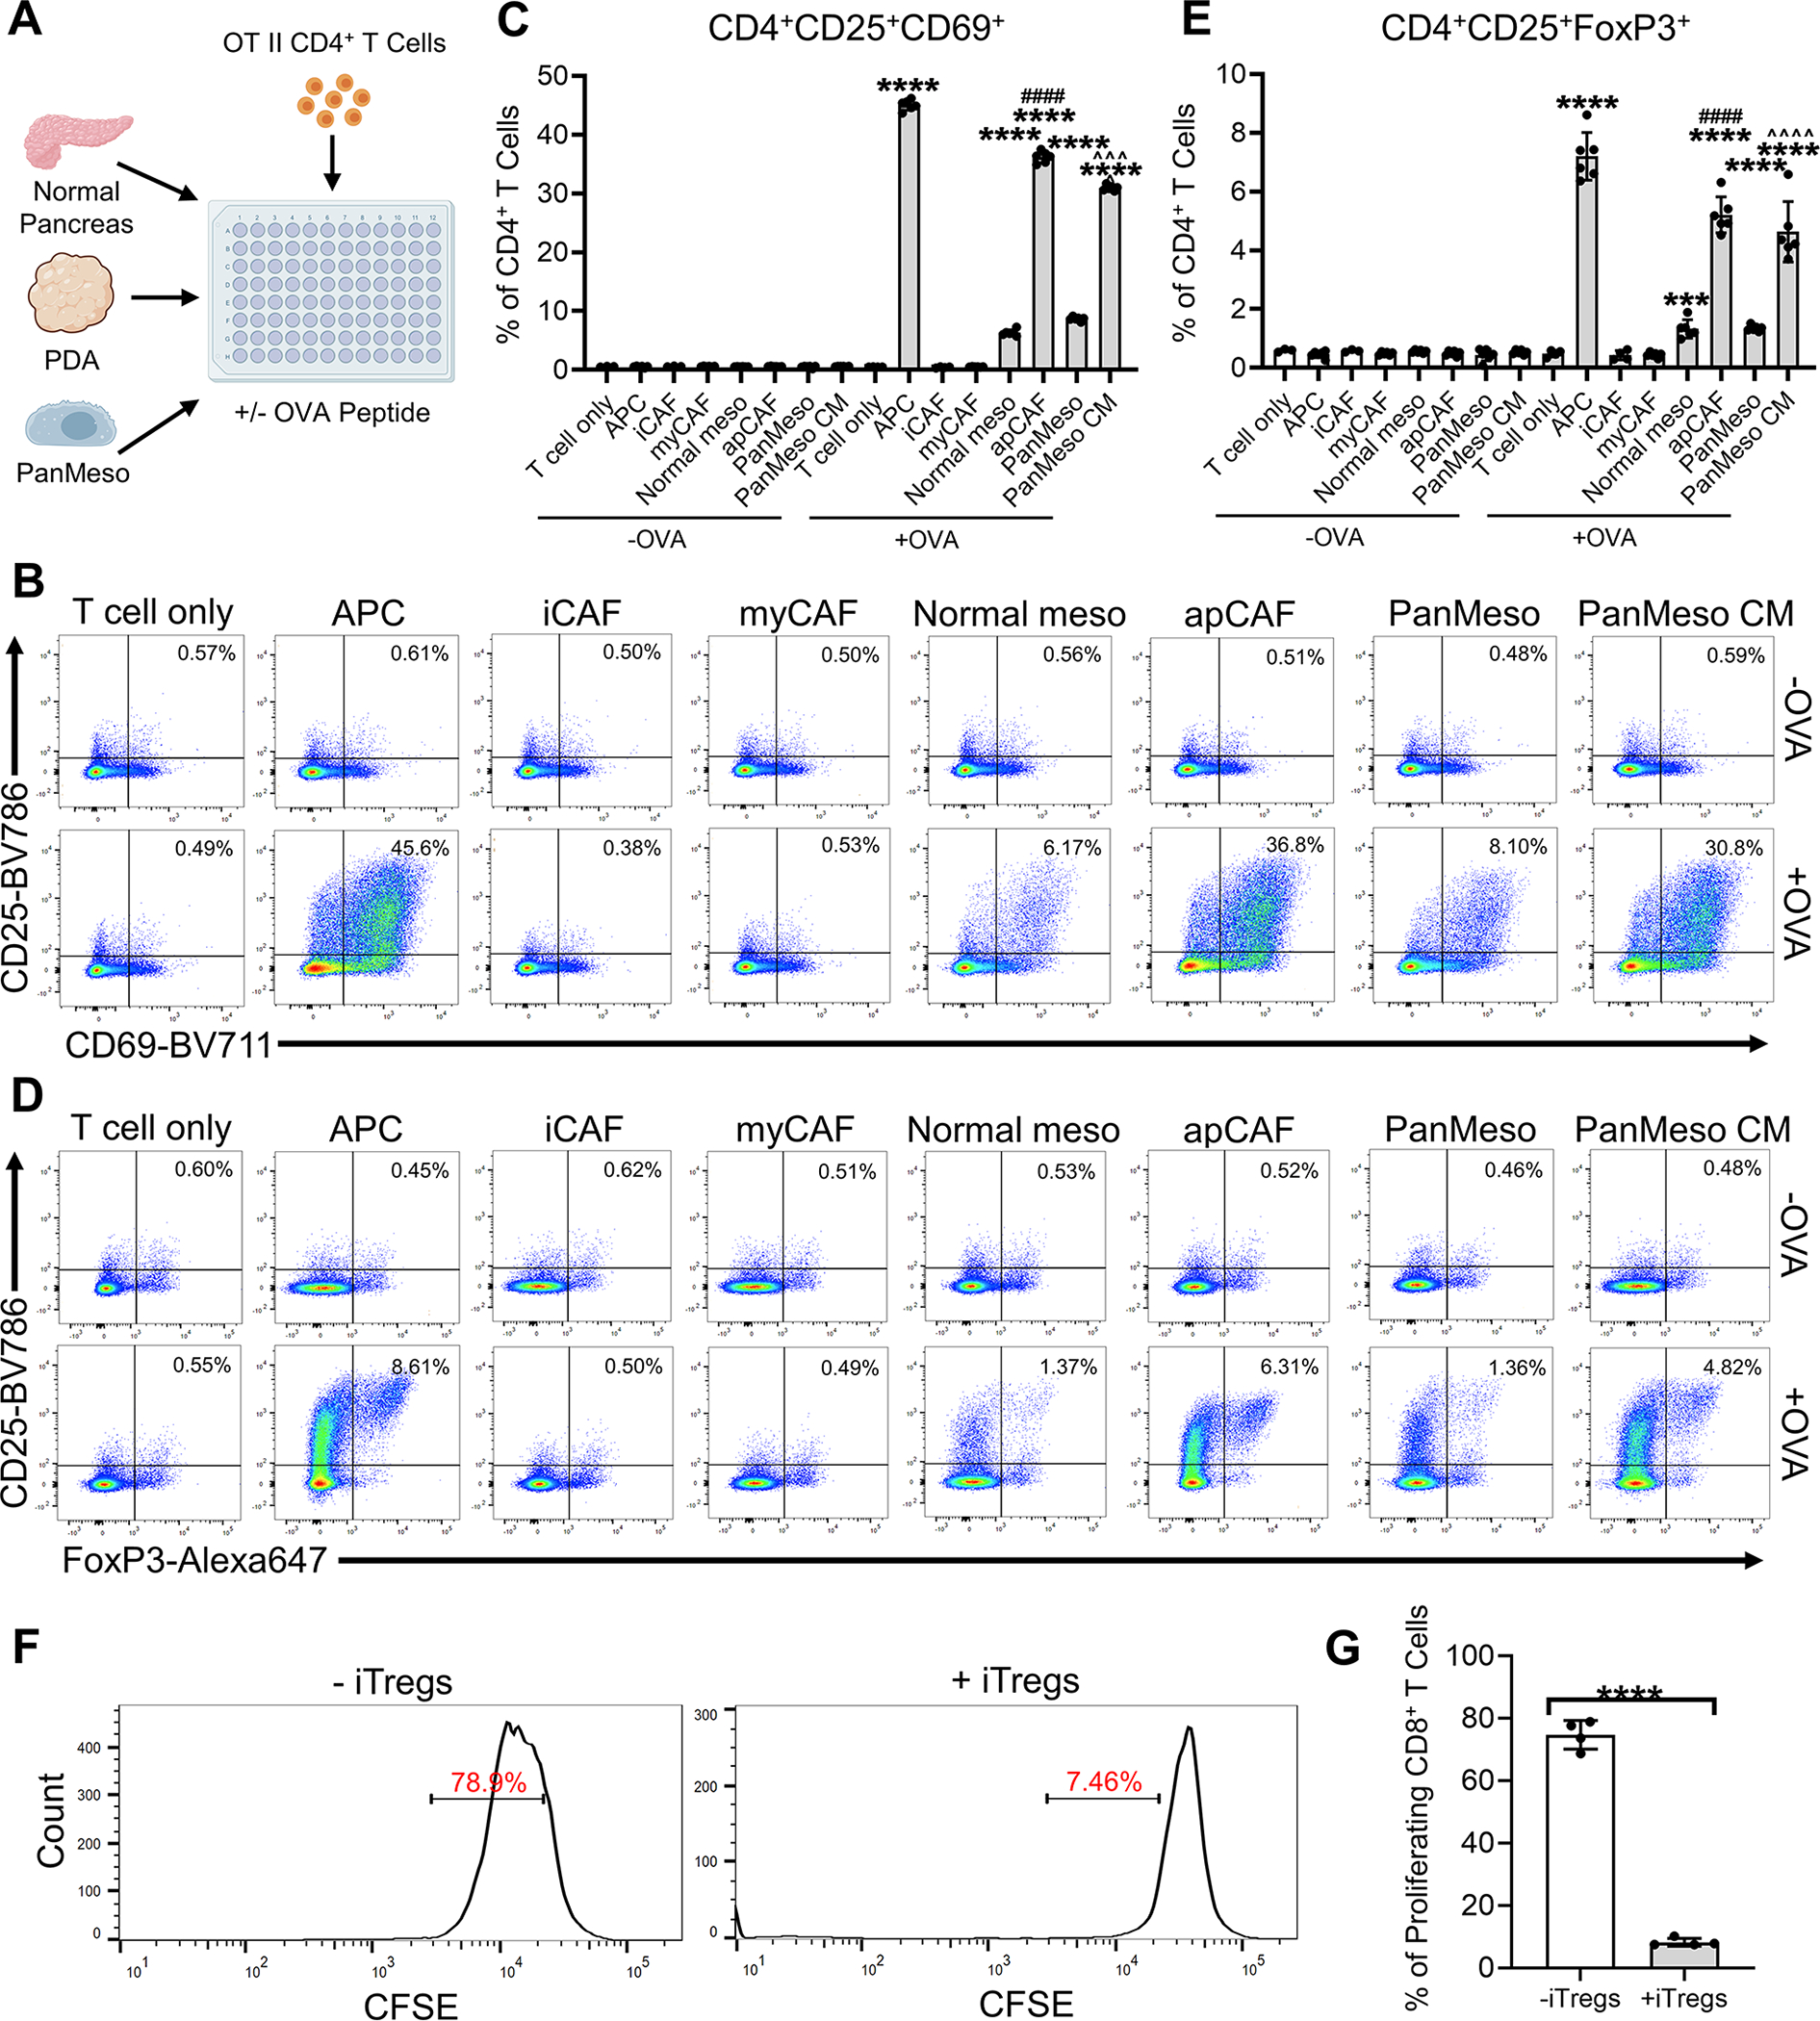
Figure 5. apCAFs Induce Naïve CD4+ T Cells into Tregs.

(A) An illustration of the APC/mesothelial cell/CAF-T cell co-culture assay.
(B-C) The CD4+ T cells after being co-cultured (A) were subjected to flow cytometry for the analysis of the early activation markers of TCR ligation CD25 and CD69 and representative plots were shown (B). CD4+CD25+CD69+ T cells of the flow cytometry were quantified (C), n=6, data shown as mean ± SD, statistical analysis, t-test, ****P<0.0001 vs without OVA control. ####P<0.0001 vs normal mesothelial cells. ^^^P<0.001 vs control PanMeso cells.
(D-E) The CD4+ T cells after being co-cultured (A) were subjected to flow cytometry for the analysis of Treg markers CD25 and FoxP3 and representative plots were shown (D). CD4+CD25+FoxP3+ Tregs of the flow cytometry were quantified (E), n=6, data shown as mean ± SD, statistical analysis, t-test, ***P<0.001, ****P<0.0001 vs without OVA control. ####P<0.0001 vs normal mesothelial cells. ^^^^P<0.0001 vs control PanMeso cells.
(F-G) Naïve OT II CD4+ T cells were co-cultured with apCAFs sorted from tumors in the absence or presence of OVA peptide. The uninduced CD4+ T cells (without OVA) and iTregs (with OVA) were then co-cultured with CFSE-labeled CD8+ T cells with subsequent flow cytometry analysis. Representative plots of CFSE-labeled CD8+ T cells were shown (F). Proliferating CD8+ T cells (CFSE low) were quantified (G), n=4, data shown as mean ± SD, statistical analysis, t-test, ****P<0.0001.
See also Figure S4.
