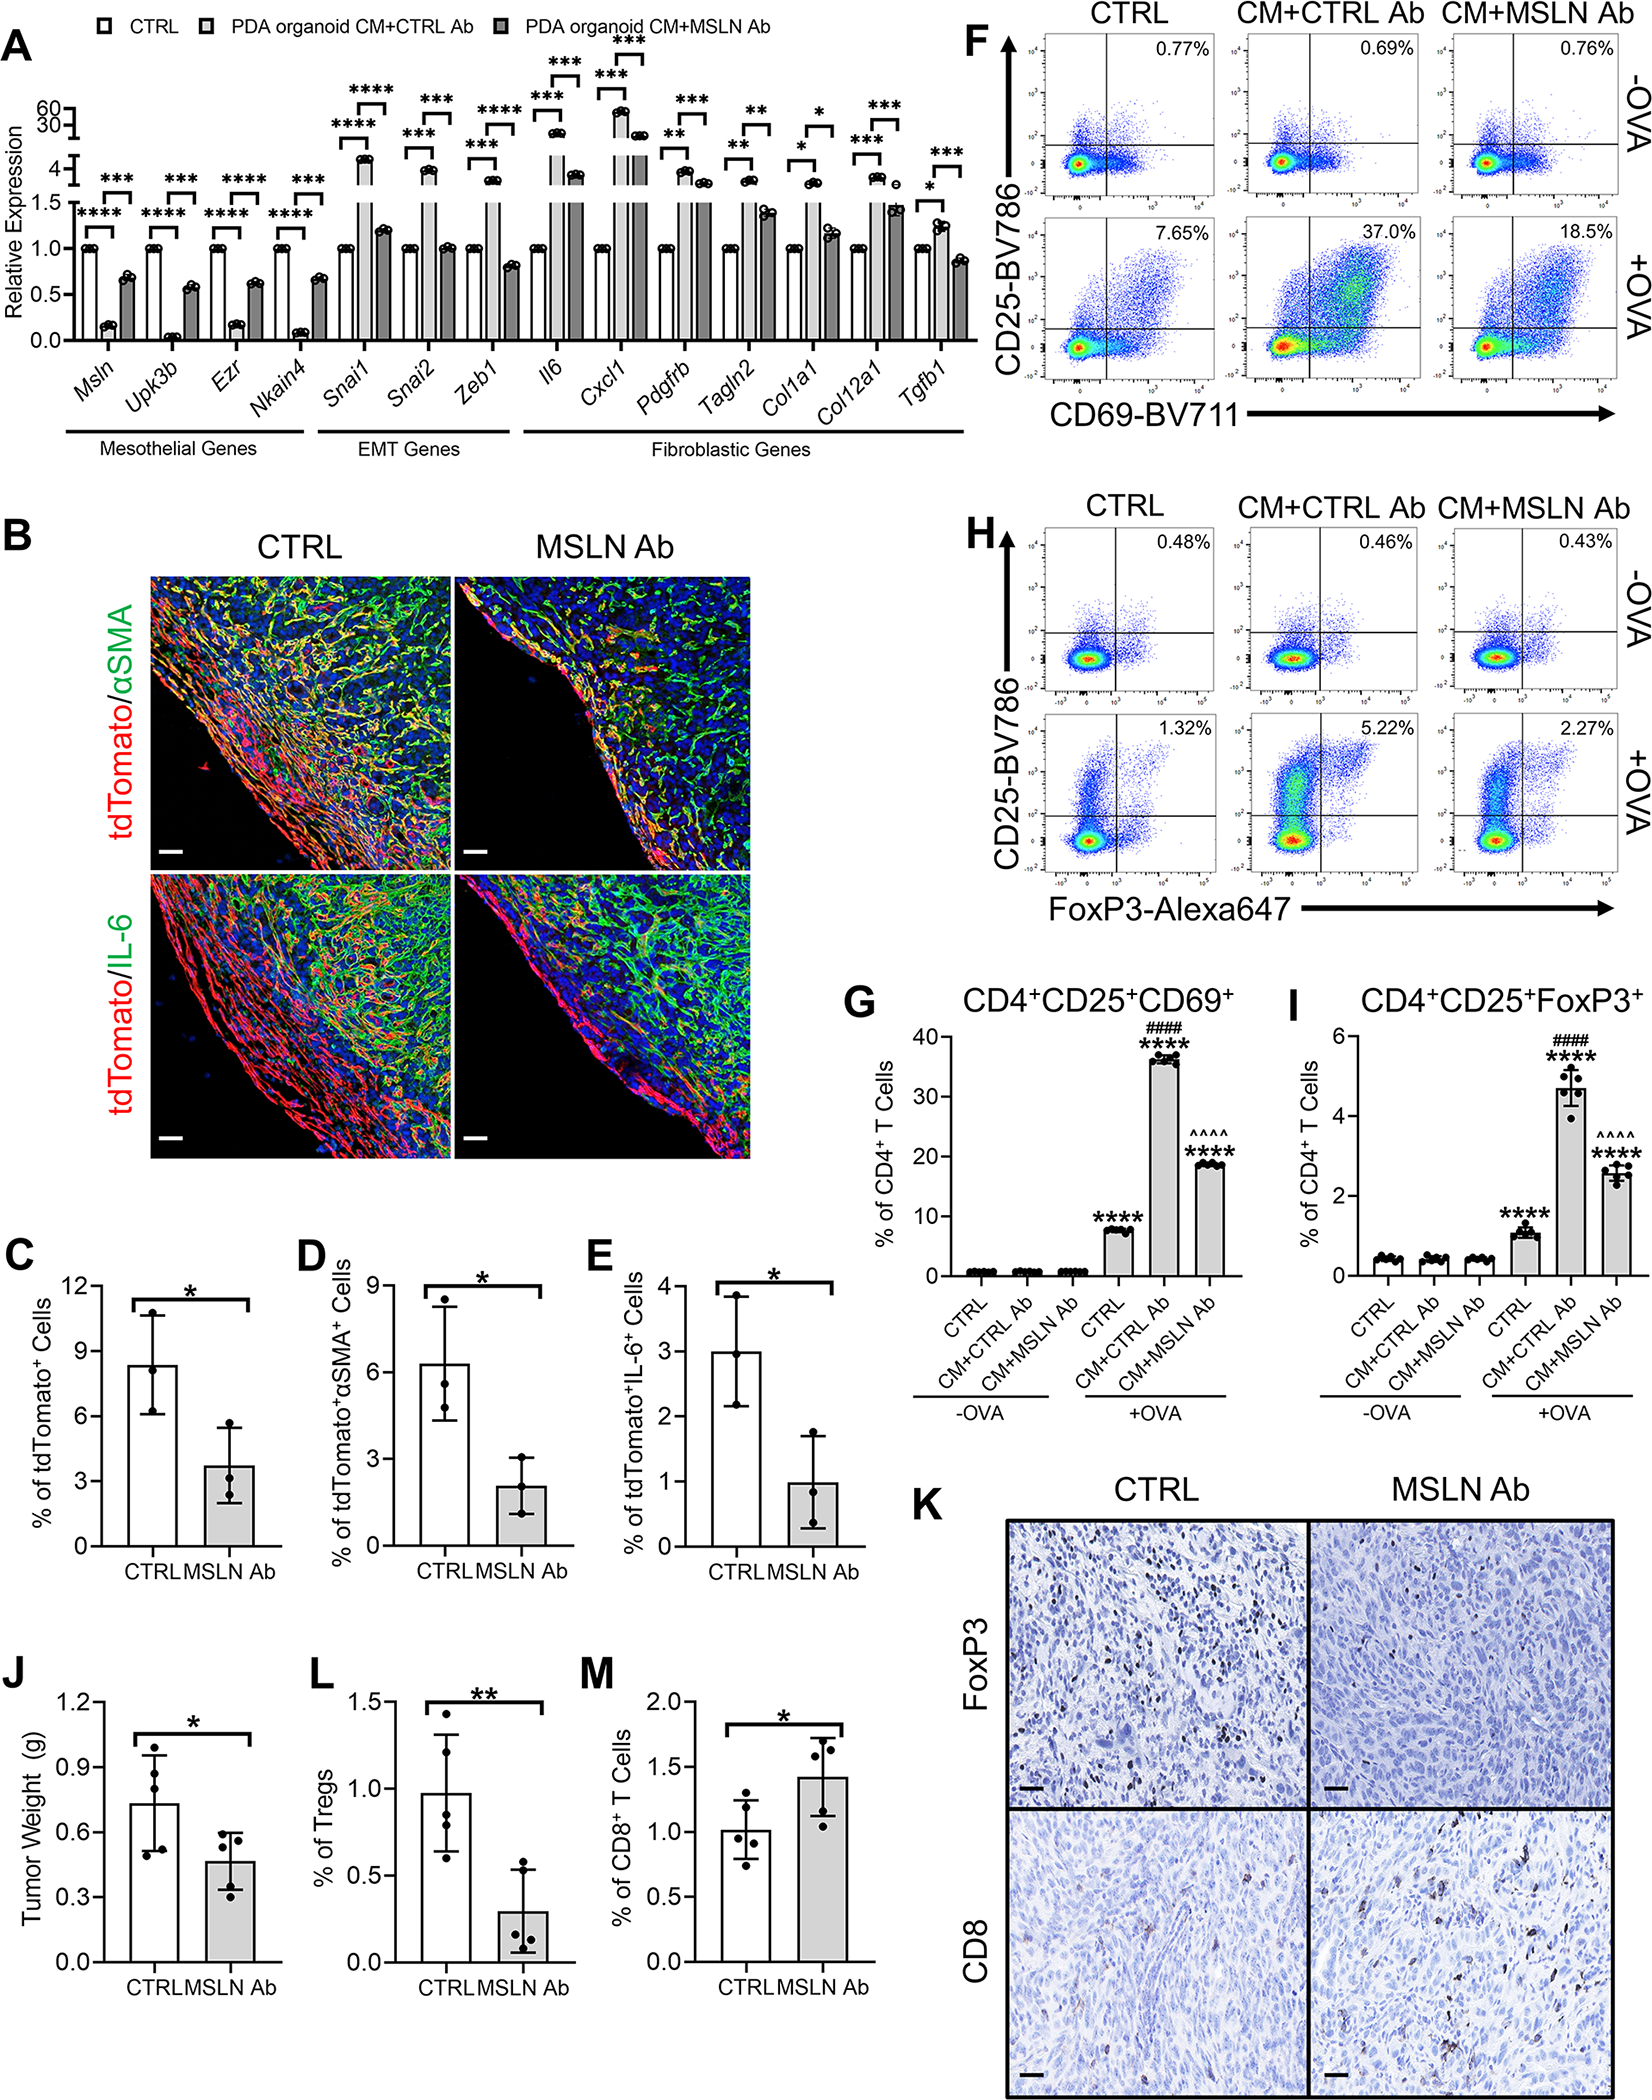
Figure 8. Inhibition of Mesothelial Cell to apCAF Transition by Targeting Mesothelin.

(A) PanMeso cells were treated with KPfC PDA organoid CM with the presence of isotype control Ab (CTRL Ab) or mouse specific mesothelin antibody (MSLN Ab) and subjected to qPCR to examine mesothelial, EMT and fibroblastic genes. n=3, data shown as mean ± SD, statistical analysis, t-test, *P<0.05, **P<0.01, ***P<0.001, ****P<0.0001.
(B-E) Seven doses of TAM were injected into the Wt1CreERT2; R26LSL-tdTomato mice to induce the tdTomato expression in mesothelial cells. 3 days after the last dose of TAM injection, mice were given 1 dose of CTRL Ab or MSLN Ab. The mice were then orthotopically injected with the KPC cell line 6499c4 5 days after the last dose of TAM injection. Control Ab or MSLN Ab treatment were given once per week during the tumor progression. Tumors were harvested 21 days after the orthotopic injection and stained for tdTomato (red), DAPI (blue), αSMA (green) or IL-6 (green) (B). Scale bar 50 μm. tdTomato+ (C), tdTomato+αSMA+ (D) and tdTomato+IL-6+ (E) cells were quantified. n=3, data shown as mean ± SD, statistical analysis, t-test, *P<0.05.
(F-G) PanMeso cells were pre-treated with control medium or PDA organoid CM in the presence of CTRL Ab or MSLN Ab for 48 hrs, washed and incubated with the OVA peptide (OVA 323–339) for 4 hrs. The PanMeso cells were then washed again and co-cultured with CD4+ T cells isolated from OT II mice for 18 hrs. The CD4+ T cells after the co-culture were subjected to flow cytometry for the analysis of the early activation markers of TCR ligation CD25 and CD69 and representative plots were shown (F). CD4+CD25+CD69+ T cells of the flow cytometry were quantified (G), n=6, data shown as mean ± SD, statistical analysis, t-test, ****P<0.0001 vs without OVA control. ####P<0.0001 vs control with OVA treatment. ^^^^P<0.0001 vs PDA organoid CM treatment.
(H-I) The CD4+ T cells after the co-culture were subjected to flow cytometry for the analysis of the Treg markers CD25 and FoxP3 and representative plots were shown (H). CD4+CD25+FoxP3+ Tregs of the flow cytometry were quantified (I), n=6, data shown as mean ± SD, statistical analysis, t-test, ****P<0.0001 vs without OVA control. ####P<0.0001 vs control with OVA treatment. ^^^^P<0.0001 vs PDA organoid CM treatment.
(J-M) C57BL/6 mice were treated with one dose of control or MSLN Ab and 6499c4 cells were then injected orthotopically into the mice. Control or MSLN Ab treatment were maintained once per week during the tumor formation. 21 days after orthotopic injection, tumors were harvested, weighed (J) and stained for FoxP3 and CD8 (K). Scale bar 25 μm. Tumor weights (J), FoxP3+ Tregs (L) and CD8+ T cells (M) were quantified. n=5, data shown as mean ± SD, statistical analysis, t-test, *P<0.05, **P<0.01.
See also Figure S6.
