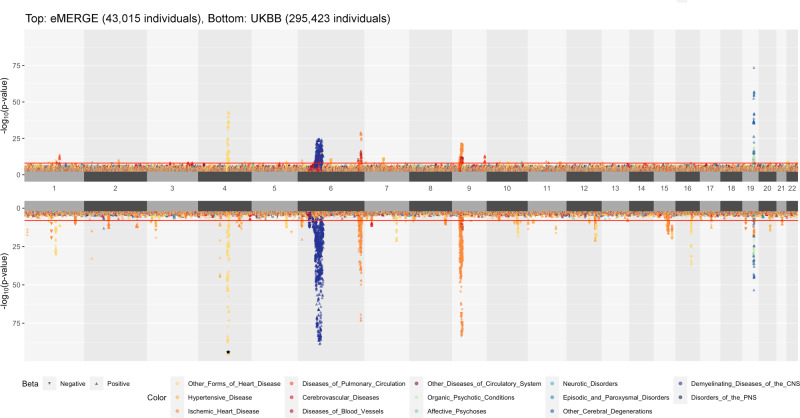
Fig. 1. Landscape of PheWAS results.
A position-to-position comparison of PheWAS results between eMERGE and UKBB. eMERGE PheWAS was performed genome-wide as the discovery analysis. UKBB PheWAS included the SNPs with p ≤ 1 × 10⁻⁴ across all tested phenotypes in eMERGE; only these SNPs were evaluated in the replication analysis. The direction of each triangle indicates the direction of genetic effect. Colors denote various disease groups. The assignment of ICD codes to disease groups can be found in Supplementary Data 1. The red line indicates the genome-wide significance threshold p-value of 1 × 10⁻⁸. To reduce the margin induced by the extremely small p-values, we have collapsed SNPs with p-value < 1 × 10−95 into one overlapping triangle indicated by an asterisk on chromosome 4 for UKBB.

