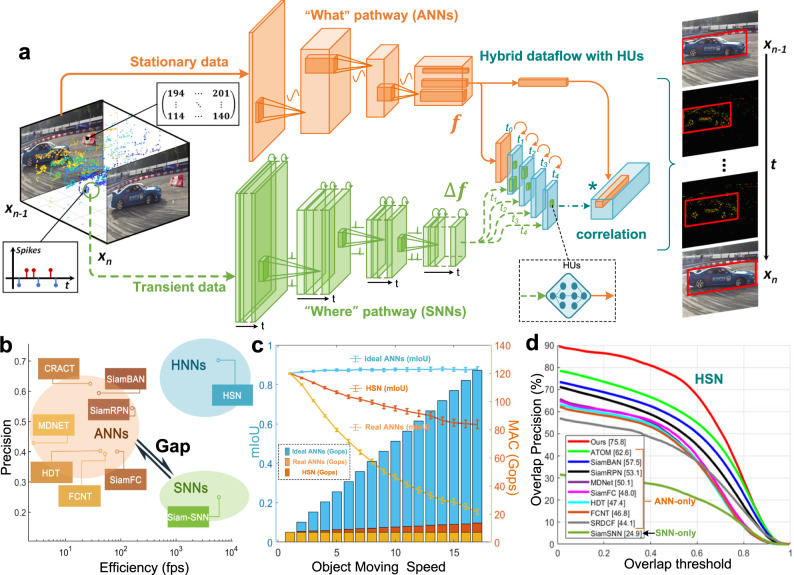
Fig. 2. Multi-pathway HSN for high-speed vision perception.
a The architecture of HSN. The orange part represents the “what” pathway processing the static information from APS, whereas the green part represents the “where” pathway processing the dynamic information from DVS. The “f” and “Δf” indicates the feature with orange and “Δfeature” with green, respectively. b Precision and speed comparison of ANNs, SNNs, and HNNs. c Network performance for different object-moving speeds and computational cost of ideal ANNs, real ANNs, and HSNs on CLEVRER-DAVIS datasets (see Supplementary Material). The x-axis refers to the results of object-moving speed accelerated by x times. The left side axis is the speed-precision curve and the right-side axis is the speed-MAC bar plot. All the experiments in this demo are independently run four times with the same setting and different initializations. The error bar represents the standard deviation of the mean IoU results. d Network performance comparison and success plots of HSN, and the state-of-the-art trackers on NFS-DAVIS and PRED. The data sources for comparison come from the published work, including CRACT21, SiamBAN22, SiamRPN23, MDNET24, HDT51, SiamFC, FCNT26, Siam-SNN19, and SRDCF27.

