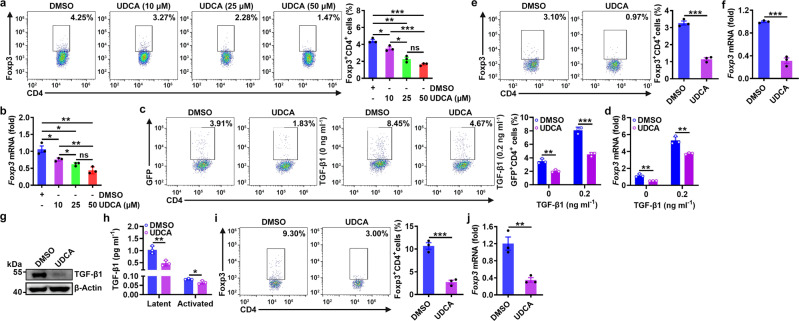
Fig. 2. UDCA inhibits Treg cell induction and function by reducing the TGF-β level.
a, b FC analysis of Foxp3+CD4+ T cells (a) and real-time PCR analysis of Foxp3 mRNA expression (b) in naïve CD4+ T cells stimulated with anti-CD3, anti-CD28, and the indicated concentration of UDCA for 3 days. c, d FC analysis of GFP+CD4+ T cells (c) and real-time PCR analysis of Foxp3 mRNA expression (d) in naïve CD4+ T cells from Foxp3GFP mice stimulated with anti-CD3, anti-CD28, and 50 μM UDCA in the absence or presence of the cytokine TGF-β1 (0.2 ng ml−1) for 3 days. e, f FC analysis of Foxp3+CD4+ T cells (e) and real-time PCR analysis of Foxp3 mRNA expression (f) in naïve CD4+ T cells from OT-II mice stimulated with 2 μg ml−1 OVA323–339 peptide plus T cell-depleted γ-irradiated splenic cells in the presence of 50 μM UDCA for 3 days. g, h Immunoblot (IB) analysis (g) or ELISA (h) of TGF-β1 in naïve CD4+ T cells stimulated with anti-CD3, anti-CD28, and 50 μM UDCA for 24 h (g) or in the culture supernatant (h). i, j FC analysis of Foxp3+CD4+ T cells (i) and real-time PCR analysis of Foxp3 mRNA expression (j) in naïve CD4+ T cells from OT-II mice cocultured with LLC-OVA cells in the presence of 50 μM UDCA for 3 days. Representative results from two (b, d, f, j) or three (a, c, e, g–i) independent experiments are shown (n = 3 in all statistical groups). *P < 0.05; **P < 0.01; ***P < 0.001; ns, not significant (unpaired two-tailed Student’s t test; mean and s.d.). See Source Data file for the exact P-values.

