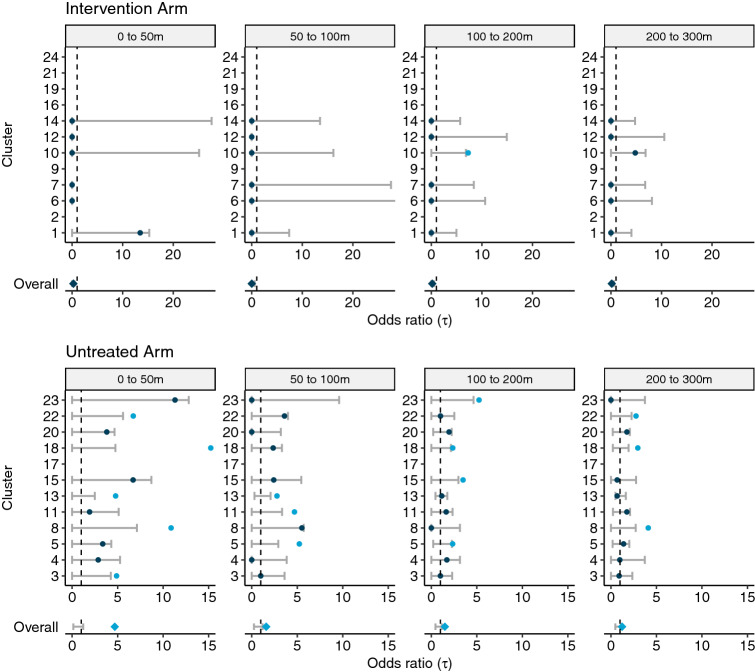
Figure 4.
Cluster-specific and pooled arm-level estimates of the -statistic (points) and 95% CIs on the null distribution (error bar) generated from 1000 simulations where the geolocation of participants is randomly permuted within each cluster. Each panel displays the estimated spatial dependence for homotypic case pairs with illness onset occurring within 30 days and resident within a given distance interval (meters) from each other. Estimated spatial dependence that is inconsistent with the null hypothesis is present when the point estimate falls outside of the 95% CIs of the null distribution and, for improved visibility, is marked by the light blue points. The overall point estimate for each trial arm is found by taking the geometric mean of the cluster-level estimates and is then compared against the 95% CIs of the null distribution of the permuted geometric mean.

