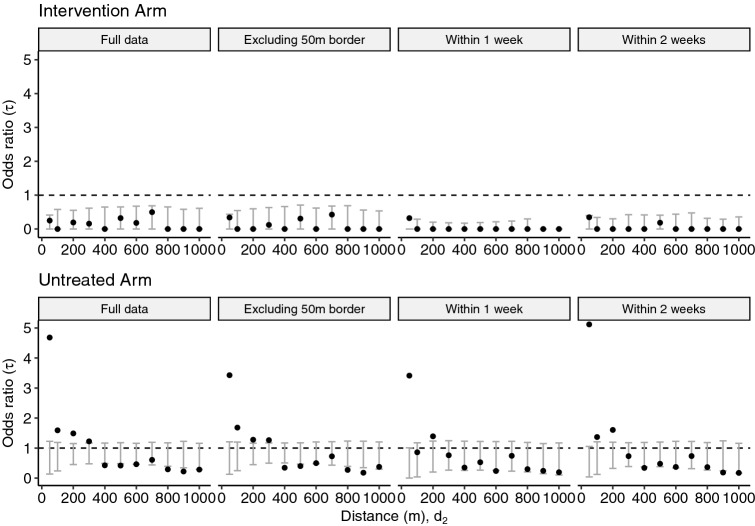
Figure 6.
Sensitivity analyses and comparison with the primary analysis. Modified geometric mean odds ratio, , comparing the odds of a homotypic dengue case pair within the distance interval versus the odds of a homotypic dengue case pair at any distance across the entire study area for (1) the full dataset, (2) the dataset excluding those within 50 m of a cluster border, (3) participant pairs with illness onset occurring within 1 week of each other, and (4) participant pairs with illness onset occurring within 2 weeks of each other. The error bars denote the 95% CI on the null distribution generated by 1000 permutations of the data.

