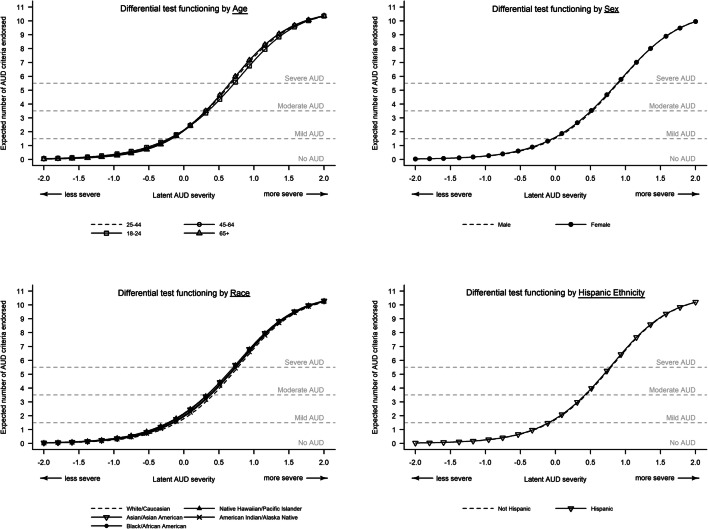
Fig. 2.
Analyses of differential test functioning for demographic subgroups. Latent alcohol use disorder (AUD) severity (x-axis) is distributed such that 0 corresponds to the sample mean (2.98 AUD criteria) and ±1 corresponds with ±1 standard deviation (SD) from the mean (SD = 3.23 criteria). Separate curves are shown to illustrate the expected number of AUD criteria endorsed (y-axis) for each demographic subgroup. Vertical distances between the plotted lines indicate the expected differences in the number of AUD criteria endorsed that are attributable to differential item functioning, when latent AUD severity is held constant between members of different subgroups. In all cases, the expected differences between expected number of AUD criteria endorsed attributable to differential item functioning (i.e., vertical distances between lines) were less than half of one criterion, which is not a clinically meaningful difference. More detailed differential item functioning results are presented in the online supplement.

