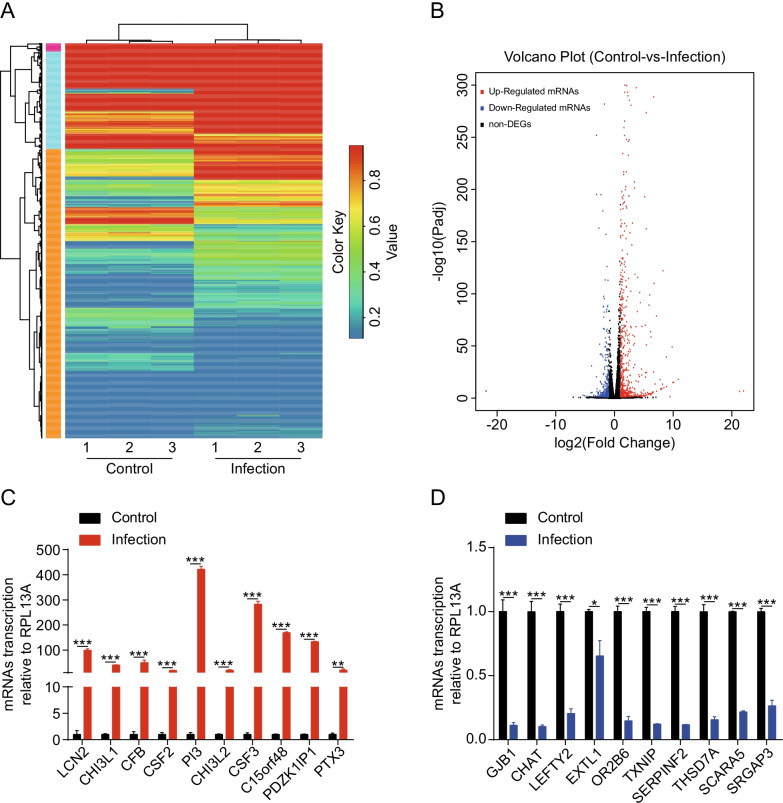
Fig. 2.
Expression profiling of the changes in messenger RNAs (mRNAs) in SARS-CoV-2-infected human brain microvascular endothelial cells (hBMECs). A Heat map showing unsupervised clustering of significantly expressed mRNAs from hBMECs in the SARS-CoV-2 infection groups compared with the control groups. The expression profiles are displayed with three samples in each group. Red represents high, while blue represents low expression, relative to that of the control. B Volcano plot of the upregulated and downregulated mRNAs from hBMECs in the SARS-CoV-2 infection group compared with the control group. Increase by ≥ twofold or decrease to ≤ 0.5-fold, p < 0.05 was considered statistically significant. C, D The relative expression levels of 20 mRNAs, including 10 downregulated and 10 upregulated ones, were examined by RT-qPCR in hBMECs infected with SARS-CoV-2 for 72 h and those without. The data from RNA-sequencing (RNA-seq) were highly consistent with the RT-qPCR results. RPL13A was used as the internal reference. Data were presented as the mean ± SD from three independent experiments. *p < 0.05, **p < 0.01, ***p < 0.001

