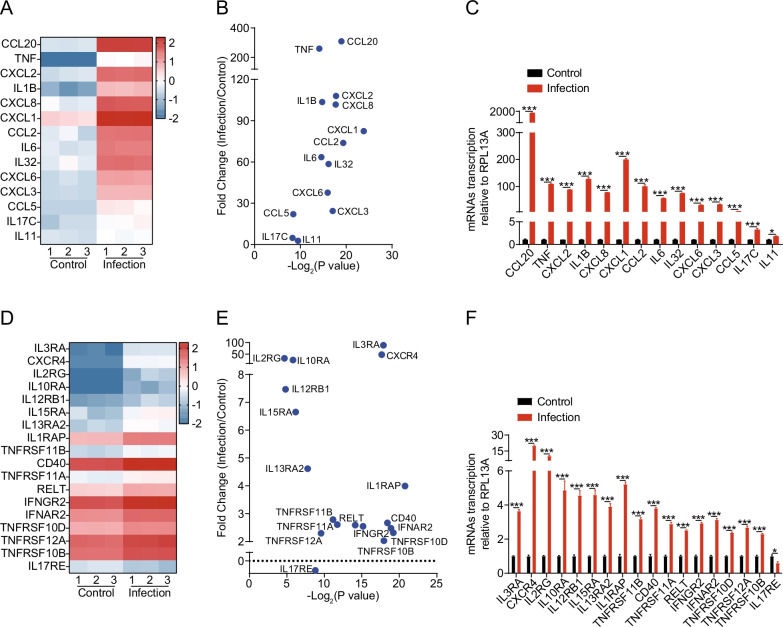
Fig. 4.
SARS-CoV-2 infection of hBMECs induced a severe inflammatory response. A Heat maps depicting virally regulated cytokines and chemokines upon SARS-CoV-2 infection in hBMECs. Colored bar represents expressive abundance of log2 transformed values. B Significance analysis and difference multiples of cytokines and chemokines in hBMECs upon SARS-CoV-2 infection. C RT-qPCR analysis of cytokines and chemokines transcription in hBMECs upon SARS-CoV-2 infection. RPL13A was used as the internal reference. Data were presented as the mean ± SD from three independent experiments. *p < 0.05, ***p < 0.001. D Heat maps depicting virally regulated cytokine receptors upon SARS-CoV-2 infection in hBMECs. Colored bar represents expressive abundance of log2-transformed values. E Significance analysis and difference multiples of cytokine receptors in hBMECs upon SARS-CoV-2 infection. F RT-qPCR analysis of cytokine receptors transcription in hBMECs upon SARS-CoV-2 infection. RPL13A was used as the internal reference. Data were presented as the mean ± SD from three independent experiments. *p < 0.05, ***p < 0.001

