FIGURE 1.
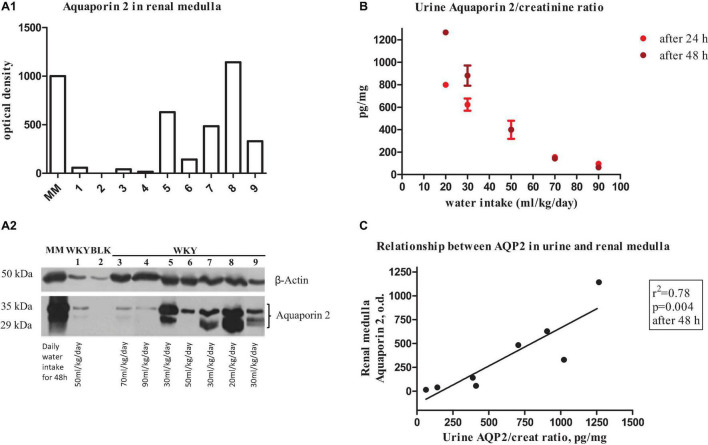
(A1) Bar graphs show quantitative changes in renal medulla aquaporin 2 protein expression in young female WKY rat measured by optical densitometry of immunoblotting (below). Bars represent the sum of the optical densities of the two bands observed for aquaporin 2 water channel (lower and upper bands represent native and glycosylated aquaporin 2, respectively). (A2) Representative immunoblot of AQP2 in renal medulla of a female WKY. Blots were incubated with polyclonal anti-AQP2 and β-Actin antibodies. MM indicates molecular weight markers. Lane 1, 6: daily water intake of 50 ml/kg; lane 3: daily water intake of 70 ml/kg; lane 4: daily water intake of 90 ml/kg; lanes 5, 7, 9: daily water intake of 30 ml/kg; and lane 8: daily water intake of 20 ml/kg. BLK indicates blank without primary anti-AQP2 antibody. (B) Urine aquaporin 2/creatinine ratio at different water intake (from 20 ml/kg to 90 ml/kg at 24 h and 48 h). (C) Relationship between urine aquaporin 2/creatinine ratio and renal medulla aquaporin 2 protein expression in the young female WKY rat.

