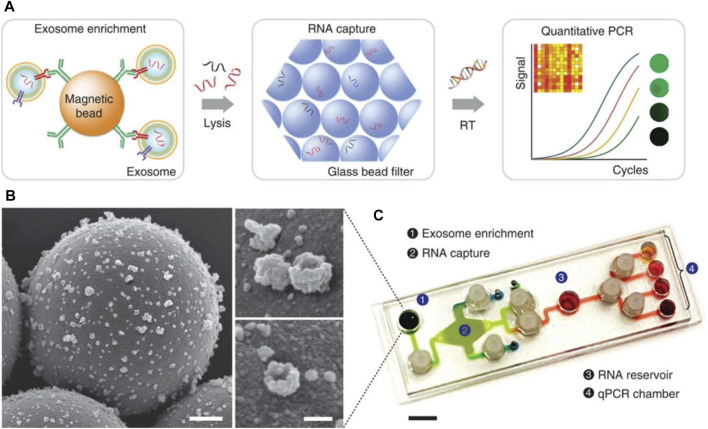
FIGURE 6.
Diagram of key steps/approaches for measuring exosome for the prediction of CVD. (A) Magnetic microbeads coated with specific antibodies enabled exosome isolation and addition of guanidine-based lysis buffer released the contents of enriched exosomes. Torque-actuated valves and permanent magnets were used to control the process. RNA is adsorbed on a glass-bead filter via electrostatic interactions and reagents are loaded to prepare for qPCR. (B) Images from scanning electron microscope of exosomes captured on antibody-coated magnetic microbeads. Scale bars 500 and 100 nm (inset) (C) Photograph of PDMS iMER cartridge. RT—Reverse transcription (Shao et al., 2015). Source: Reprinted in its original form under CC BY license. License access: https://creativecommons.org/licenses/by/4.0/legalcode.

