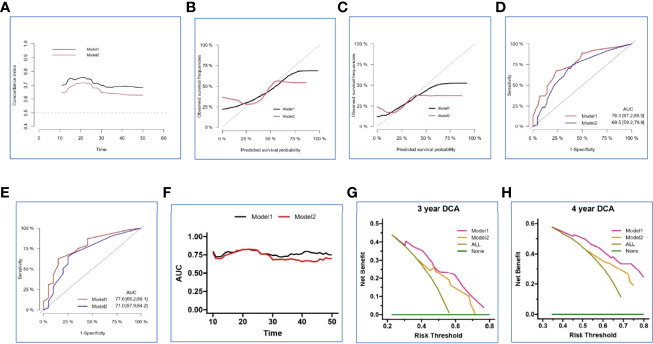
Figure 6.
Validation and comparison of two nomogram models in the internal set. The time-dependent concordance index (C-index) (A), 3- and 4-year calibration curves (B, C), 3- and 4-year ROC analysis (D, E), time-dependent area under the curve (AUC) (F), 3- and 4-year decision curve analysis (DCA) (G, H) basing on Model 1 and Model 2.

