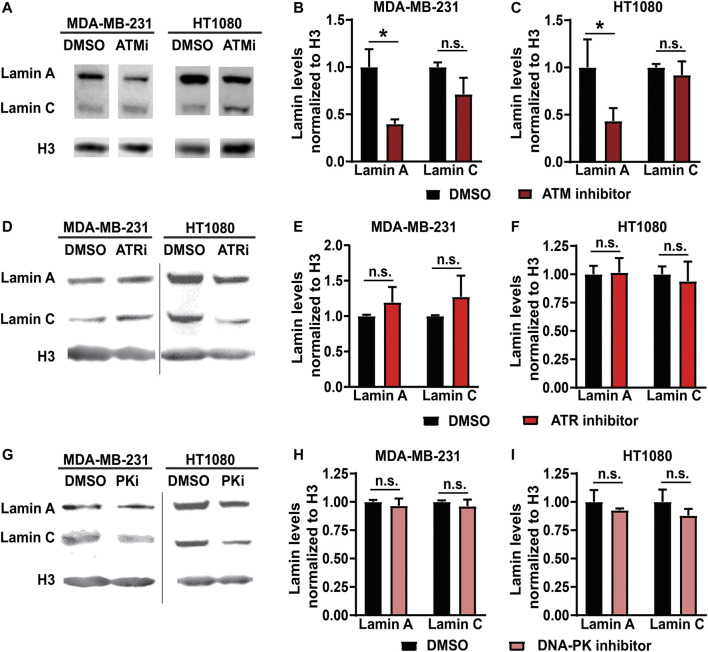
FIGURE 1.
Inhibition of ATM but not ATR or DNA-PK reduces lamin A levels. (A) Representative immunoblot for lamin A and lamin C of MDA-MB-231 and HT1080 cells treated with 10 µM of ATM inhibitor KU-55933 or 0.1% DMSO for 48 h. Histone H3 was used as loading control. (B) Quantification of lamin A and C protein levels from immunoblots of MDA-MB-231 cells, based on three independent experiments. Lamin levels were normalized to DMSO treated cells. *, p < 0.05 based on Two-way ANOVA with Tukey’s multiple comparison test. N = 3 (C) Quantification of lamin A and C protein levels from immunoblots of HT1080 cells, based on three independent experiments. Lamin levels were normalized to DMSO treated cells. *, p < 0.05 based on Two-way ANOVA with Tukey’s multiple comparison test. N = 3 (D) Representative immunoblot for lamin A and lamin C of MDA-MB-231 and HT1080 cells treated with 10 µM of ATR inhibitor VE-821 or 0.1% DMSO for 48 h. Histone H3 was used as loading control. (E) Quantification of lamin A and C protein levels from immunoblots for MDA-MB-231 cells, based on three independent experiments. Lamin levels were normalized to DMSO treated cells. Differences were not statistically significant (n.s.) based on two-way ANOVA. N = 3 (F) Quantification of lamin A and C protein levels from immunoblots for HT1080 cells, based on three independent experiments. Lamin levels were normalized to DMSO treated cells. Differences were not statistically significant (n.s.) based on two-way ANOVA. N = 3 (G) Representative immunoblot for lamin A and lamin C of MDA-MB-231 and HT1080 cells treated with 5 µM of DNA-PK inhibitor NU7441 or 0.1% DMSO for 48 h. Histone H3 was used as loading control. (H) Quantification of lamin A and C protein levels from immunoblots for MDA-MB-231 cells, based on three independent experiments. Lamin levels were normalized to DMSO treated cells. Differences were not statistically significant (n.s.) based on two-way ANOVA. N = 3. (I) Quantification of lamin A and C protein levels from immunoblots for HT1080 cells, based on three independent experiments. Lamin levels were normalized to DMSO treated cells. Differences were not statistically significant (n.s.) based on two-way ANOVA. N = 3 Error bars in this figure represent mean ± s. e.m.

