
FIGURE 2.
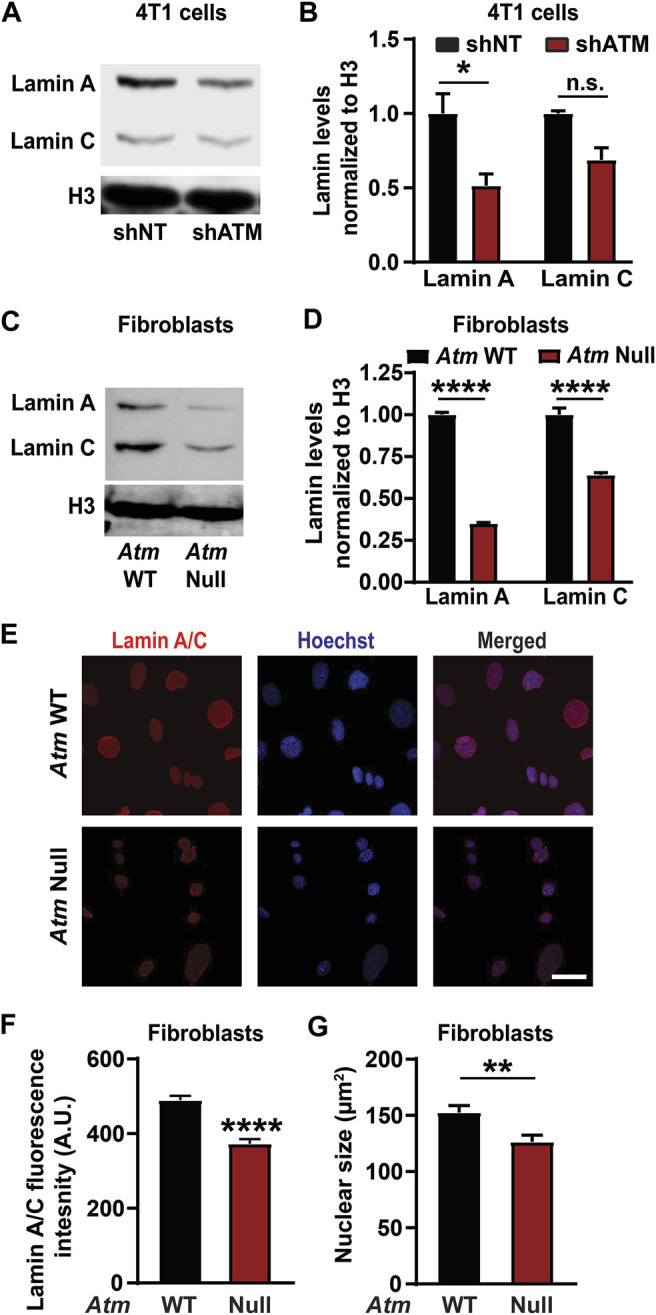
ATM deletion and depletion reduce lamin A levels. (A) Representative immunoblot for lamin A and lamin C of 4T1 cells with doxycycline induced ATM depletion by shRNA (shATM) and non-target (shNT) controls following 4 days of treatment with doxycycline. Histone H3 was used as loading control. (B) Corresponding quantification of the lamin A and C levels based on three independent experiments. Lamin levels were normalized to shNT cells. *, p < 0.05 based on Two-way ANOVA with Tukey’s multiple comparison test. N = 3. (C) Representative immunoblot for lamin A and lamin C of MEFs with Atm deletion (Atm-Null) and wild-type (WT) controls. Histone H3 was used as loading control. (D) Corresponding quantification of lamin A and C protein levels from immunoblots based on three independent experiments. Lamin levels were normalized to WT controls. ****, p < 0.0001 based on two-way ANOVA with Tukey’s multiple comparison test. N = 3. (E) Representative image panel of immunofluorescence staining for lamin A/C of Atm-Null and wild-type (WT) MEFs. Scale bar: 20 µm (F) Corresponding quantification of the lamin A/C total immunofluorescence intensity per nucleus, based on the mean values from three independent experiments. N = 3; representing a total of 184 cells for wild-type and 154 cells for Atm-Null. ****, p < 0.0001, based on unpaired t-test with Welch’s correction. (G) Quantification of nuclear size of Atm-Null and WT MEFs. **, p < 0.01, based on the mean values of three independent experiments, using unpaired t-test with Welch’s correction. Error bars in this figure represent mean ± s. e.m. of the mean values of each experiment.