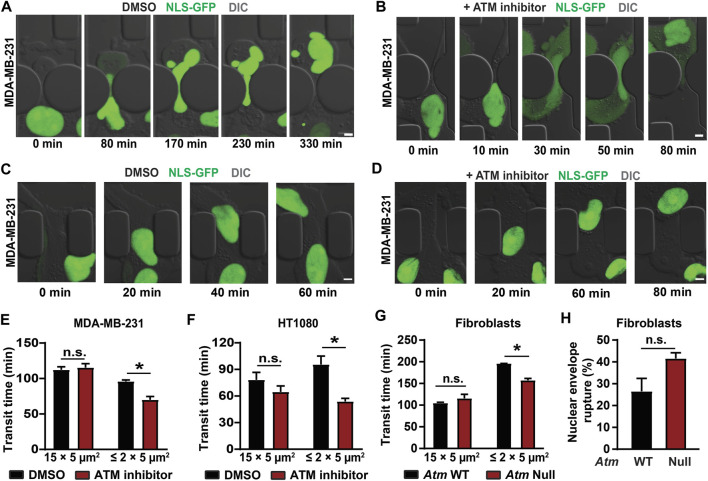
FIGURE 5.
Cells lacking ATM migrate faster through confined spaces. (A) Representative time-lapse image sequences of an MDA-MB-231 breast cancer cell expressing NLS-GFP and treated with vehicle control (DMSO) during migration through a 1 × 5 μm2 constriction in the microfluidic device. Scale bar: 5 µm. (B) Representative image sequence of an MDA-MB-231 breast cancer cell expressing NLS-GFP and treated with an ATM inhibitor (KU-55933) during migration through a 1 × 5 μm2 constriction in the microfluidic device. Scale bar: 5 µm. (C) Representative time-lapse image sequences of an MDA-MB-231 breast cancer cell expressing NLS-GFP and treated with vehicle control (DMSO) during migration through a 15 × 5 μm2 control channel in the microfluidic device. Scale bar: 5 µm. (D) Representative image sequence of an MDA-MB-231 breast cancer cell expressing NLS-GFP and treated with an ATM inhibitor (KU-55933) during migration through a 15 × 5 μm2 control channel in the microfluidic device. Scale bar: 5 µm. (E) Quantification of transit times for MDA-MB-231 cells to migrate through ≤2 × 5 μm2 constrictions or 15 × 5 μm2 control channels when treated with ATM inhibitor KU-55933 or vehicle control (DMSO). *, p < 0.05 based on two-way ANOVA with Tukey’s multiple comparison test; N = 3 for each group, representing the means of three independent experiments; total number of cells analyzed: 114 cells for DMSO and 83 cells for ATM inhibitor for the small constrictions; 72 cells for DMSO and 38 cells for ATM inhibitor for the larger control channels. (F) Transit times for HT1080 fibrosarcoma cells to cross the ≤ 2 × 5 μm2 constrictions or 15 × 5 μm2 control channels when treated with ATM inhibitor KU-55933 or vehicle control (DMSO). *, p < 0.05 based on Two-way ANOVA with Tukey’s multiple comparison test; N = 3 for each group, representing the means of three independent experiments; total number of cells analyzed: 200 cells for DMSO and 276 cells for ATM inhibitor for the small constrictions; 182 cells for DMSO and 140 cells for ATM inhibitor for the larger control channels. (G) Transit times for Atm wild-type (WT) or Atm-Null MEFs to cross the ≤ 2 × 5 μm2 constrictions or the 15 × 5 μm2 control channels. *, p < 0.05 based on Two-way ANOVA with Tukey’s multiple comparison test; N = 3 for each group, representing the means of three independent experiments; total number of cells analyzed: 336 Atm WT and 221 Atm-Null MEFs for the small constrictions; 133 Atm WT and 111 Atm-Null MEFs for the larger control channels. (H) Quantification of nuclear envelope rupture events of Atm WT and Atm-Null MEFs migrating through the ≤ 2 × 5 μm2 constrictions. The difference was not statically significant (p = 0.11, based on the means of three independent experiments. N = 3. Error bars in this figure represent mean ± s. e.m. of the mean values of each experiment.

