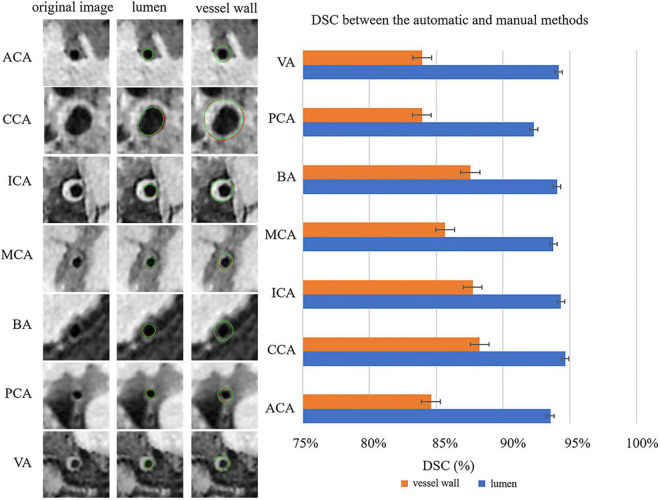
FIGURE 4.
Representative images and DSCs between the automatic and manual methods for the seven arterial segments. On the left, the first column represents the original cross-sectional slices reconstructed from MR vessel wall images; in the second column, the red contours represent the automatic segmentation results of the lumen, and the green contours represent the manual segmentation results of the lumen. In the third column, the red contour represents the automatically segmented results of the outer vessel wall, and the green contour represents the manual segmentation results of the outer vessel wall. The DSCs of the seven arterial segments are shown on the right using a bar plot.

