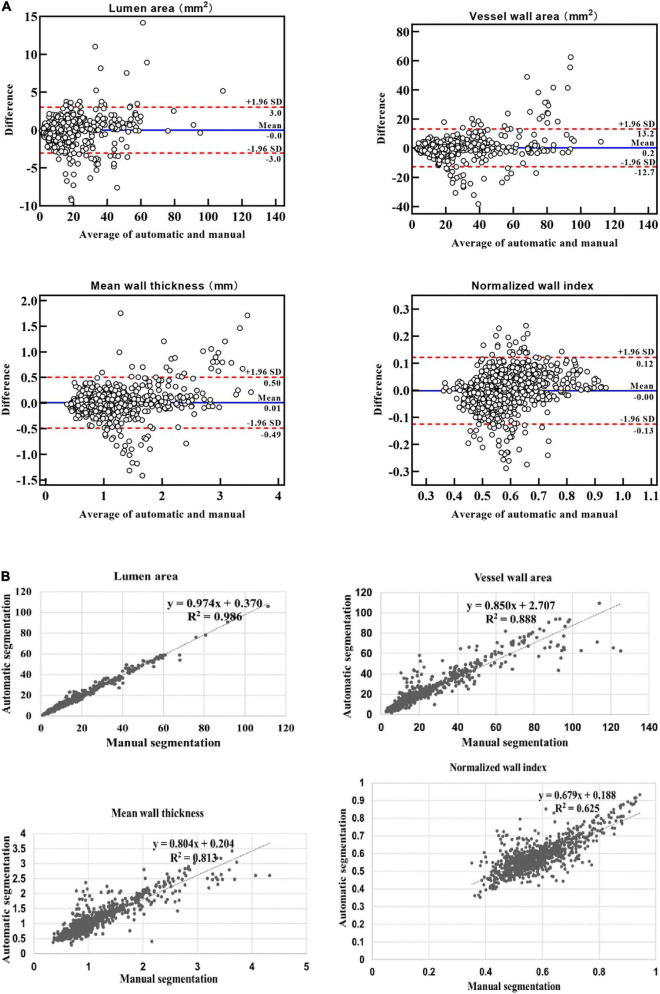
FIGURE 7.
Bland–Altman plots and scatter plots between the automatic method and manual method for the lumen area, wall area, mean wall thickness, and normalized wall index. In panel (A), the blue lines indicate the mean difference, and the red line represents the 95% CI (computed through average difference ±1.96 SD of the difference). CI, confidence intervals; SD, standard deviation. In panel (B), the x-axis shows the manual segmentation value. The y-axis represents the automatic segmentation value.

