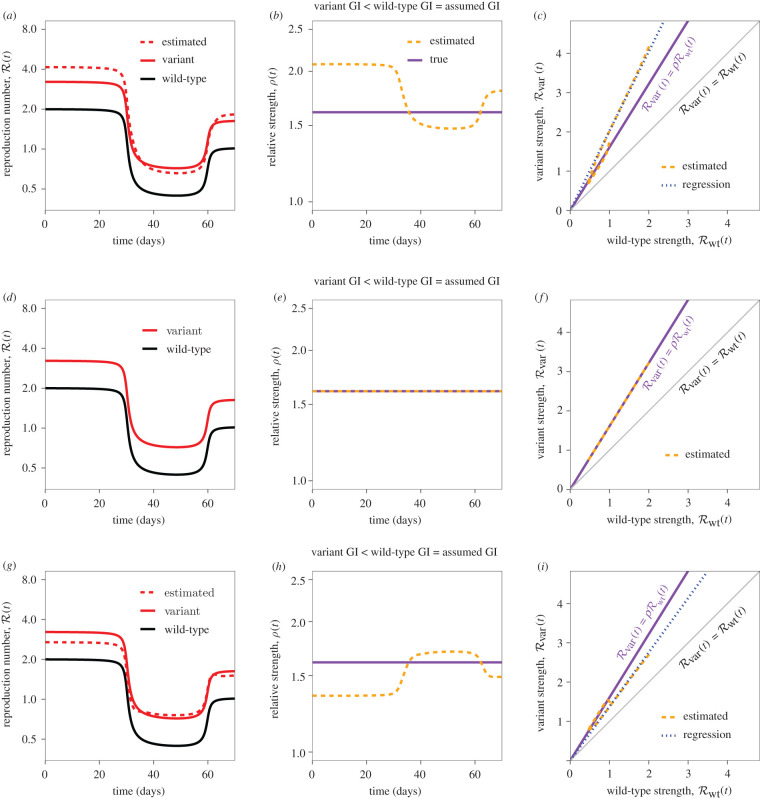
Figure 3.
Estimates of relative strength over time under different scenarios. (a,d,g) True (solid lines) and estimated (dashed lines) reproduction numbers of the new variant and the wild-type over time. (b,e,h) True (purple, solid) and estimated (orange, dashed) ratios between reproduction numbers of the new variant and the wild-type over time. (c,f,i) Phase planes (time is implicit) showing true (purple, solid) and estimated (orange, dashed) relationships between estimated reproduction numbers. Blue dotted lines represent the regression lines of the estimated variant reproduction numbers against the estimated wild-type reproduction numbers. Grey lines represent the one-to-one line. For all simulations, the assumed mean generation interval is equal to the mean generation interval of the wild-type (5 d), and the squared coefficient of variation in generation intervals is equal to κ = 1/5. The mean generation interval of the variant is equal to 4 d (a–c), 5 d (d–f) and 6 d (g–i).

