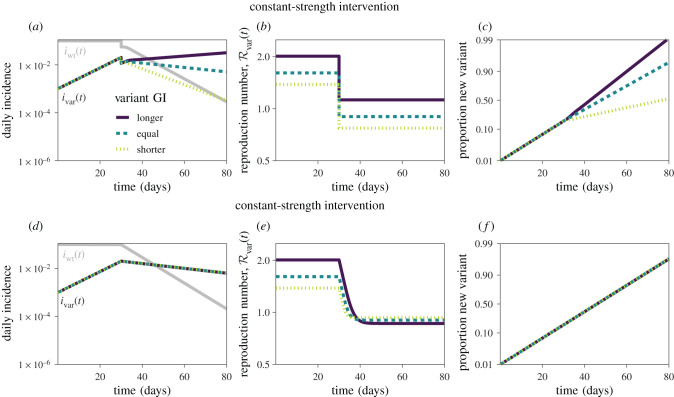
Figure 5.
Simulations of constant-strength and constant-speed interventions. Constant-strength (a–c) and constant-speed (d–f) interventions are simulated using the renewal equation (see electronic supplementary material for details of simulations). (a,d) Daily incidence of infections caused by the wild-type (, grey) and the variant (ivar(t), coloured). (b,e) Instantaneous reproduction number of the variant calculated using equation (2.2). (c,f) Proportion of incidence of infections caused by the variant on a logit scale. Epidemic trajectories are calculated assuming , δ = 0.1 d−1, , and κ = 1/5 for pre-intervention conditions, and then introducing constant-strength and constant-speed interventions on day 30. The pre-intervention ratio between the mean generation interval is assumed to equal 1.5 (longer), 1 (equal) and 1/1.5 (shorter) for three different scenarios. The constant-strength and constant-speed interventions are identically modelled as illustrated in figure 4.

