
Figure 1.
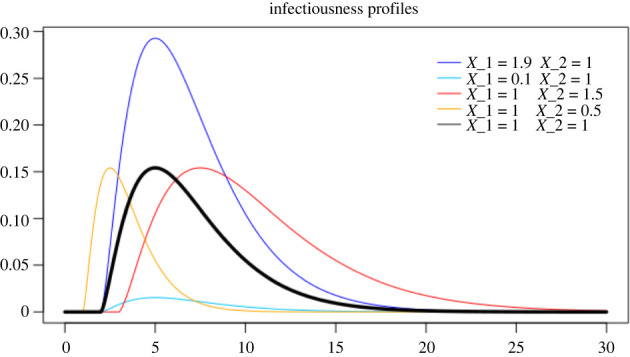
In black, the deterministic curve that shapes the infectiousness process. In colours, various infectiousness profiles, corresponding to the most extreme cases: in blue and light blue, the highest and lowest peak of infectiousness, respectively; in red and orange, the latest and earliest peaks of infectiousness, respectively.