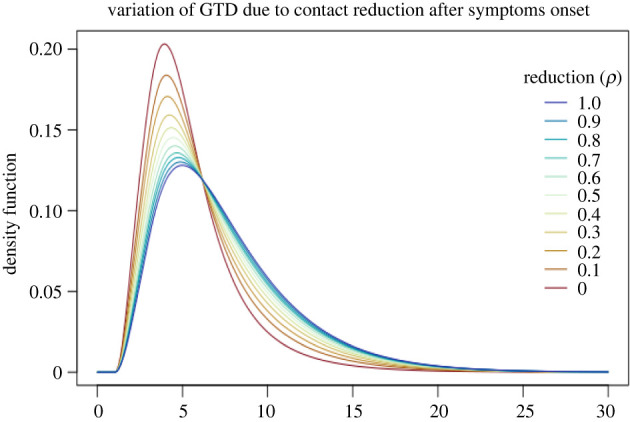
Figure 2.

The generation time distribution (GTD) for different values of ρ, the reducing fraction of contact activity at symptoms onset. No other interventions are in place, i.e. σ = 0, p = 0. The blue line corresponds to no reduction (ρ = 1) and the red line corresponds to complete isolation (ρ = 0) at symptoms onset.
