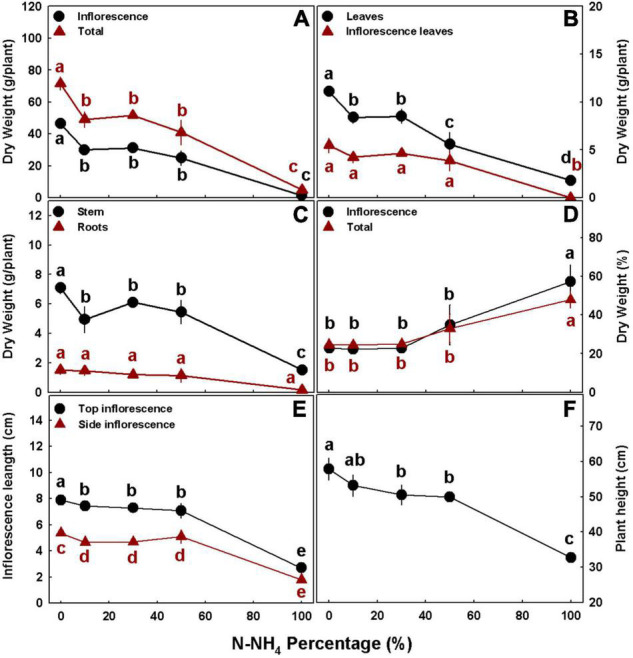
FIGURE 3.

Effect of NH4/NO3 ratio on plant biomass and development in medical cannabis plants. Dry weights of inflorescences and whole plant (A), leaves and inflorescence leaves (B), stem and roots (C), % dry weight of inflorescences and whole plant (D), inflorescence length for the top (primary) inflorescence and side (secondary) inflorescence (E), and plant height (F). Presented data are averages ± SE (n = 5). Different small letters above the means represent significant differences between treatments within a curve by Tukey HSD test at α = 0.05.
