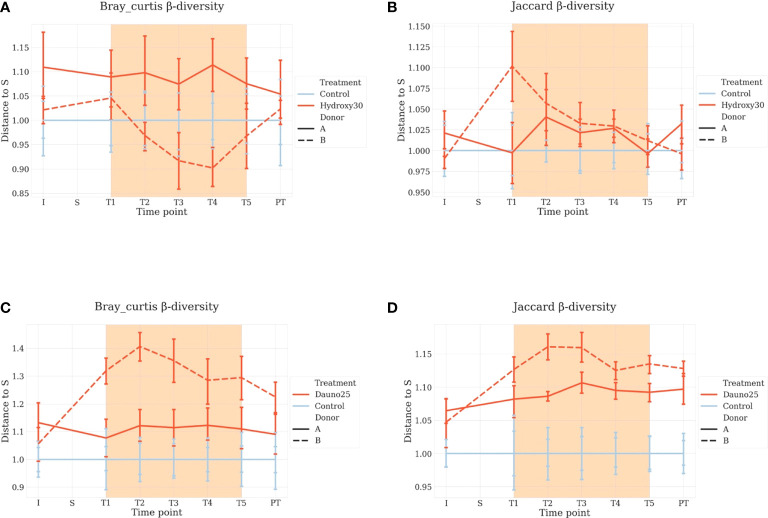
Figure 4.
Beta diversity Bray–Curtis (A–C) and Jaccard metrics (B–D) representation. Each condition is compared with the control at the same time point, and S is baseline. Light blue represents the controls, and red represents the treated groups. Orange square represents the treatment period (average and 68% CI). All time points are normalized so that control chambers average at 1. (A, B) Hydroxycarbamide; (C, D) daunorubicin.

