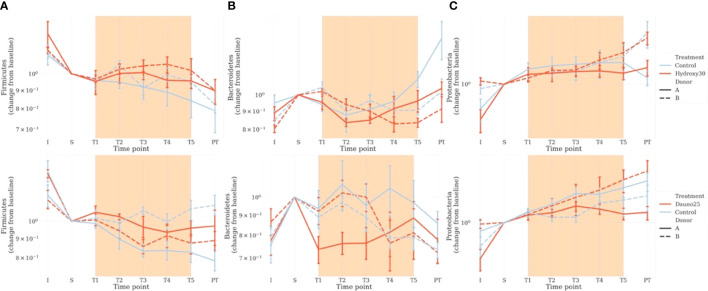
Figure 5.
Impact of the treatments on the main 3 phyla of interest: Firmicutes (A), Bacteroidetes (B), and Proteobacteria (C). Counts were estimated from rarefied tables. Fecal bacterial composition was analyzed after 16S rRNA gene sequencing. Solid lines represent donor A, and dotted lines represent donor (B) Light blue represents the controls, and red represents the treated groups. Orange square represents the treatment period (average and 68% CI). The top figure represents hydroxycarbamide, and the bottom figure represents daunorubicin.

