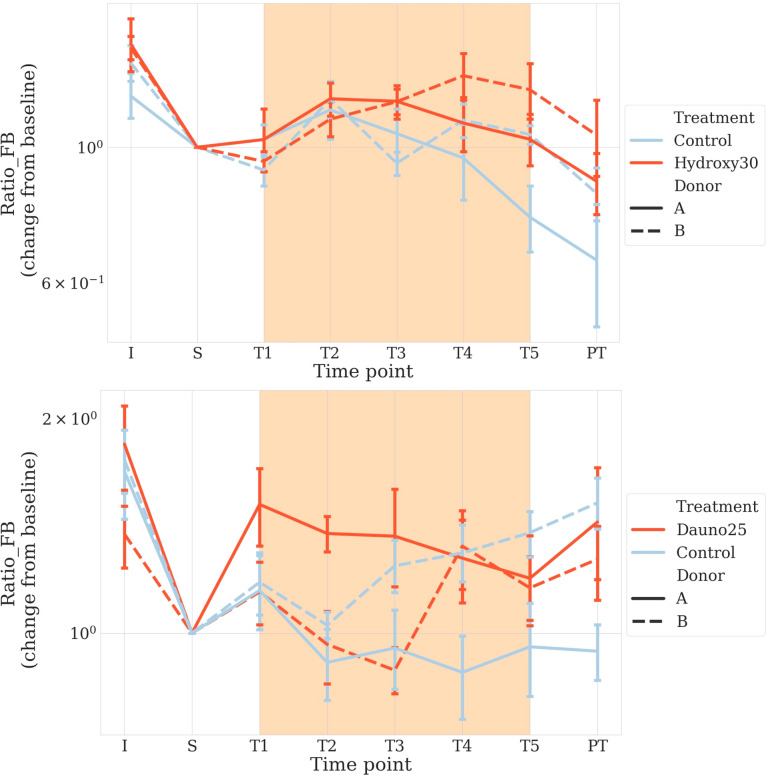
Figure 6.
Firmicutes to Bacteroidetes ratio to early detect dysbiosis after treatment. Solid lines represent donor A, and dotted lines represent donor B Light blue represents the controls, and red represents the treated groups. Orange square represents the treatment period (average and 68% CI). The top figure represents hydroxycarbamide, and the bottom figure represents daunorubicin.

