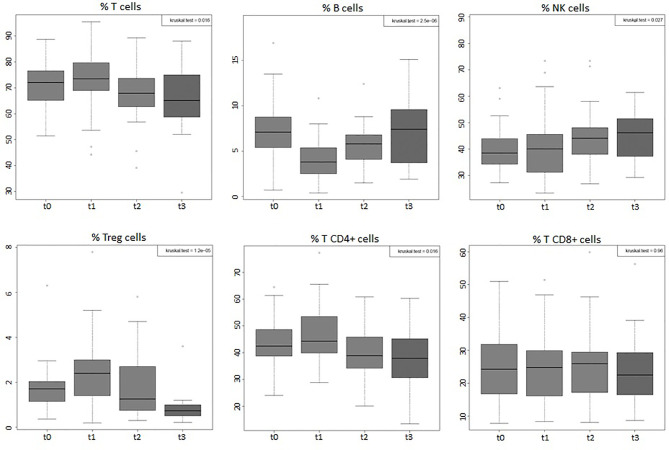
Figure 3.
Boxplots of the percentages, among total lymphocytes, of total T, B, NK, Tregs, T CD4, and T CD8 cells of the entire group of prostate cancer patients (44) undergoing curative RT. The data shown evidenced variations statistically significant during the four time points considered (Kruskal–Wallis test, p-value < 0.05), except for T CD8+ cells that did not undergo significant changes. t0: before RT; t1: end of RT; t2: 3 months after RT; t3: 6 months after RT.

