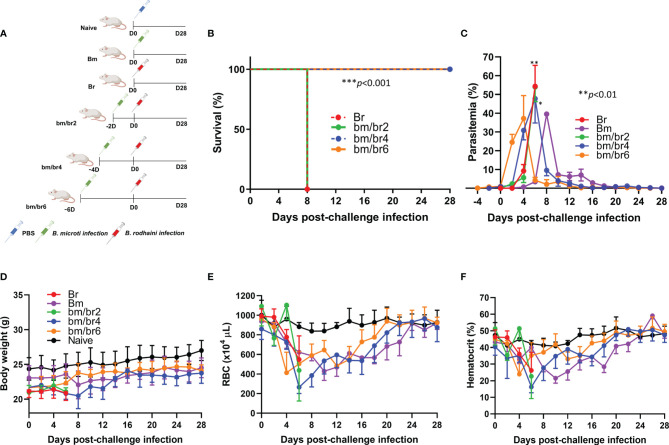
Figure 1.
The course of B. rodhaini challenge infection in BALB/c mice undergoing acute B. microti infection. Test BALB/c mice were initially infected with B. microti and then challenge infected with B. rodhaini at different time points (on days 2, 4, 6) post-primary infection. (A) Overall experimental plan. (B) Survival curve, (C) course of parasitemia, (D) body weight, (E) red blood cell (RBC) count, and (F) hematocrit values were monitored for 28 days after challenge infection. Mean percent parasitemia, body weight, RBC, and hematocrit values were calculated from individual values taken from all surviving mice at each specific time point. Results are expressed as the mean values ± standard deviation (SD) of six mice (n = 6). Ordinary one-way analysis of variance (ANOVA) with Tukey’s test was used for the comparison of parasitemia between Br and co-infected groups, while the Kaplan-Meier non-parametric model was used for the survival analysis. Asterisks indicate statistical significance (*p < 0.05; **p < 0.01; ***p < 0.001).

