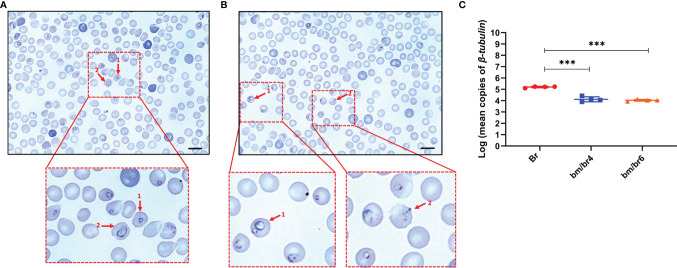
Figure 2.
Giemsa-stained thin blood smear showing (A) 1, B. microti; 2, B. rodhaini infecting mouse erythrocytes and (B) 1, B. microti and B. rodhaini infecting the same erythrocyte; 2, crisis form of Babesia. Bars represent 10 μm. (C) Mean copy numbers of B. rodhaini β-tubulin in mouse DNA samples (n = 4 per group at day 4 post-challenge infection) were transformed to log values. Individual values are the mean of duplicate samples. Log values were analyzed using one-way ANOVA and Tukey’s multiple comparison post-hoc test; ***p < 0.001.

