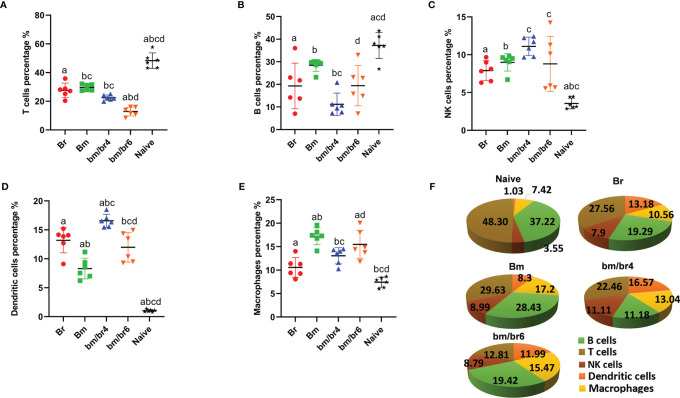
Figure 3.
Fluorescence-activated sorting (FACS) analysis of splenic immune cells of mice at day 6 post-challenge infection. Percentage population of each cell type is presented as mean ± SD: (A) CD45+ CD3+ cells (T cells), (B) CD45+ CD19+ cells (B cells), (C) CD45+ CD49b+ cells (natural killer cells), (D) CD45+ CD11c+ cells (dendritic cells), and (E) CD45+ F4/80+ cells (macrophages). (F) Pie chart representing the population composition of T cells, B lymphocytes, NK cells, dendritic cells, and macrophages in Naive, Br, Bm, bm/br4, and bm/br6 groups. Different letters denote significant differences between groups.

