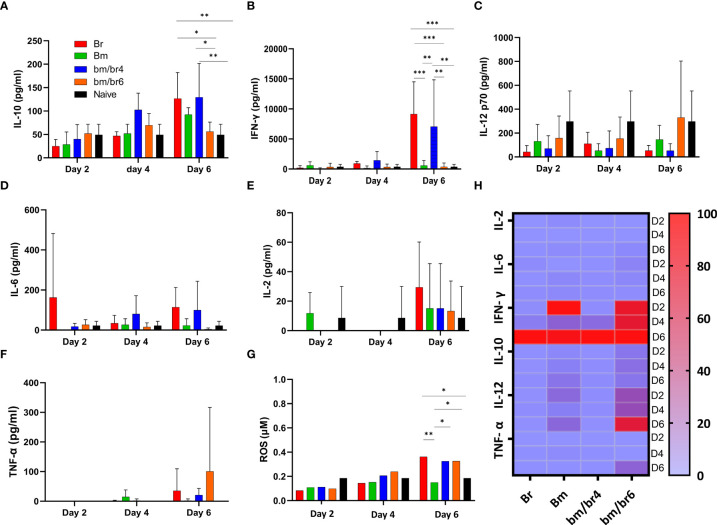
Figure 4.
The kinetics of serum cytokines of protected and susceptible mice after B. rodhaini challenge infection. Test mice were initially infected with B. microti and challenge infected with B. rodhaini on days 4 and 6. On day 6 post-challenge infection, serum was collected from all groups and levels of (A) IL-10, (B) IFN- γ, (C) IL-12p70, (D) IL-6, (E) IL-2, and (F) TNF-α were measured. (G) ROS levels were determined by measuring serum levels of H2O2. (H) Heatmap showing the progression of secretion of the six cytokines at timepoints day 2 (reference), 4, 6 pci. The results are expressed as means ± SD. Ordinary one-way analysis of variance (ANOVA) with Tukey’s test was used for the statistical analysis. Asterisks indicate statistical significance (*p < 0.05; **p < 0.01; ***p < 0.001).

